
A. Tentori, A. Colaïtis, D. Batani. 3D Monte-Carlo model to study the transport of hot electrons in the context of inertial confinement fusion. Part I[J]. Matter and Radiation at Extremes, 2022, 7(6): 065902
- Matter and Radiation at Extremes
- Vol. 7, Issue 6, 065902 (2022)
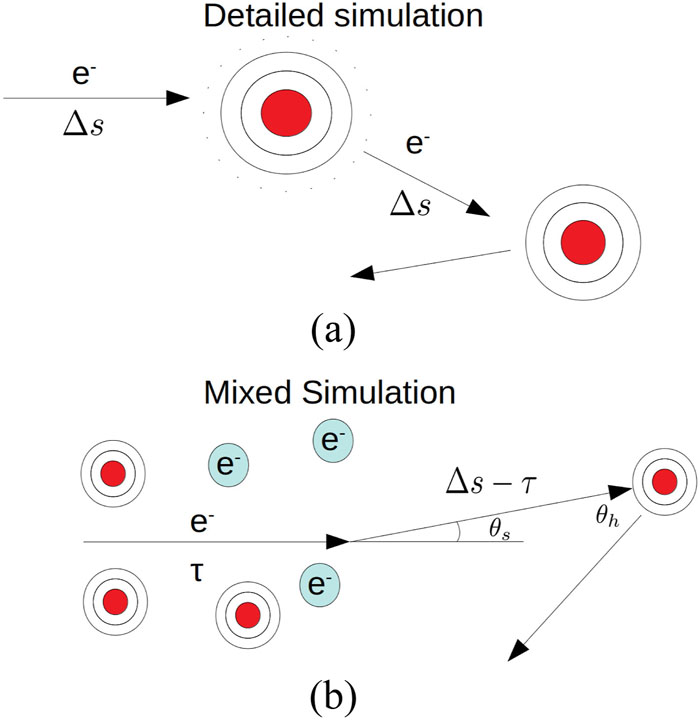
Fig. 1. Schematic representation of the two algorithms: (a) detailed simulation algorithm; (b) mixed simulation algorithm. In a detailed simulation, each scattering event is simulated individually in a two-body interaction. In the mixed algorithm, soft and hard collisions are simulated separately.
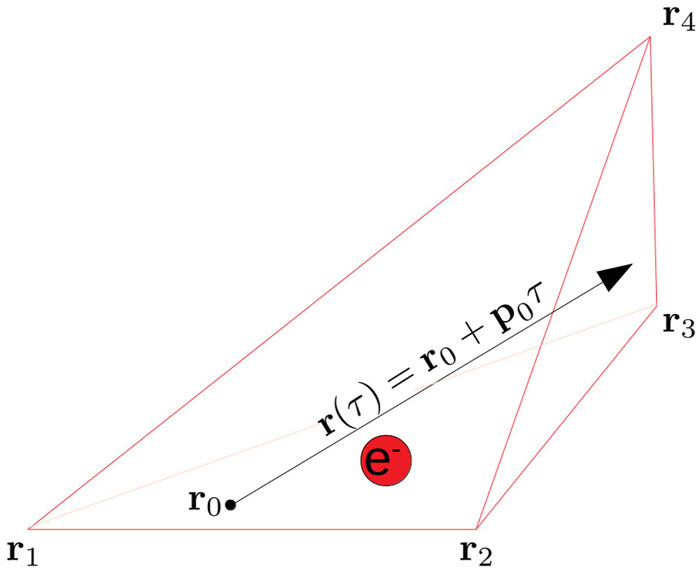
Fig. 2. Grid element of the mesh in which the electron propagates. The position of each node is indicated by the vector r i . r 0 indicates the position at which the particle enters the tetrahedron, while r (τ ) is the path traveled by the particle in the tetrahedron.
Fig. 3. Density profile of a CH planar target irradiated by a laser at an intensity of 1016 W/cm2. The density profile is extracted from a hydrodynamic simulation using the CHIC73 code, after 500 ps of irradiation. The laser is coming from the left.
Fig. 4. Calculation of the collision distance for an electron moving in a computational domain subdivided into triangular cells. In each cell k , the medium density is constant and the electron will be characterized by a mean free path λ k . The path traveled by the electron before reaching the boundary of the k th cell is l k . The paths of the fictitious particle and of the electron are indicated by the red and black arrows, respectively. The collision point of the two particles is denoted by x .
Fig. 5. Energy deposition in a 0.4 × 0.4 mm2, 200 µ m thick slab as a function of the initial monochromatic electron beam energy, computed by our model (red dots) and by Geant4 (orange dots). The simulated slab was composed of (a) beryllium and (b) gold.
Fig. 6. Energy deposition in a 0.4 × 0.4 mm2, 200 µ m thick CH slab as a function of the initial monochromatic electron beam energy, computed by our model (red dots) and by Geant4 (orange dots). The black crosses indicate the deposited energy computed by our model, assuming a low degree of ionization of the material (T = 1 eV).
Fig. 7. (a) Schematic representation of simulations performed to benchmark our MC model against Geant4. Electrons were injected into a 0.4 × 0.4 mm2 CH slab at 100 µ m from the left side. In this case, the simulated slab was 275 µ m thick. (b) and (c) Electron energy spectra at the exit from the target for initial target thicknesses of 200 and 275 µ m, respectively, as predicted by Geant4 (orange curves) and by our model (blue curves). The input electron distribution function was a 2D Maxwellian with a temperature of 26 keV.


Set citation alerts for the article
Please enter your email address

© Copyright 2018-2021 | Chinese Laser Press. All Rights Reserved 沪ICP备15018463号-20