• Chinese Optics Letters
  • Vol. 18, Issue 1, 011901 (2020)
Shuang Chen1, Suying Yang2, Yan Huang1, Weiyan Jiao3, Guanghua Fan3, and Yachen Gao1、*
Author Affiliations
  • 1College of Electronic Engineering, Heilongjiang University, Harbin 150080, China
  • 2Physics Group, Chaoyang Medical School, Chaoyang 122000, China
  • 3College of Physics, Harbin Institute of Technology, Harbin 150001, China
  • show less
    DOI: 10.3788/COL202018.011901 Cite this Article Set citation alerts
    Shuang Chen, Suying Yang, Yan Huang, Weiyan Jiao, Guanghua Fan, Yachen Gao. Wavelength-dependent nonlinear absorption of gold nanocages[J]. Chinese Optics Letters, 2020, 18(1): 011901 Copy Citation Text show less
    SEM image and size distribution of the gold nanocages (inset).
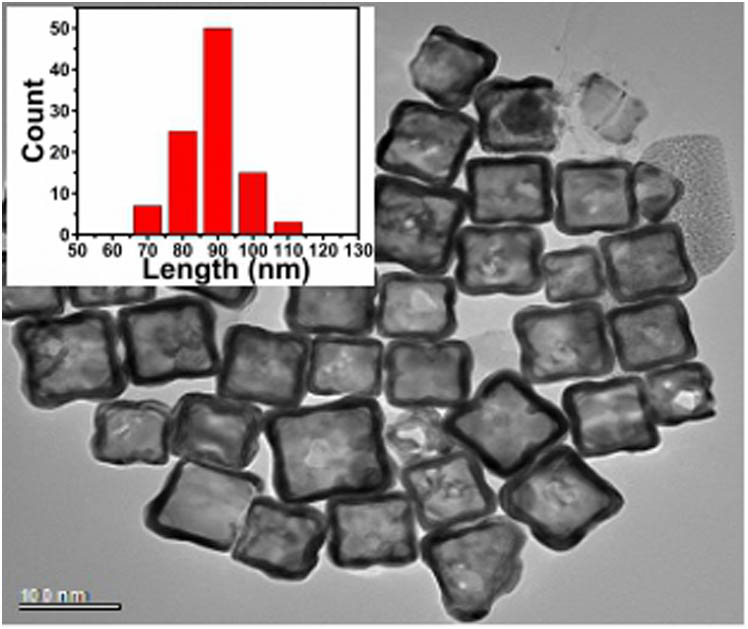
    Fig. 1. SEM image and size distribution of the gold nanocages (inset).
    Linear absorption spectra of gold nanocages.
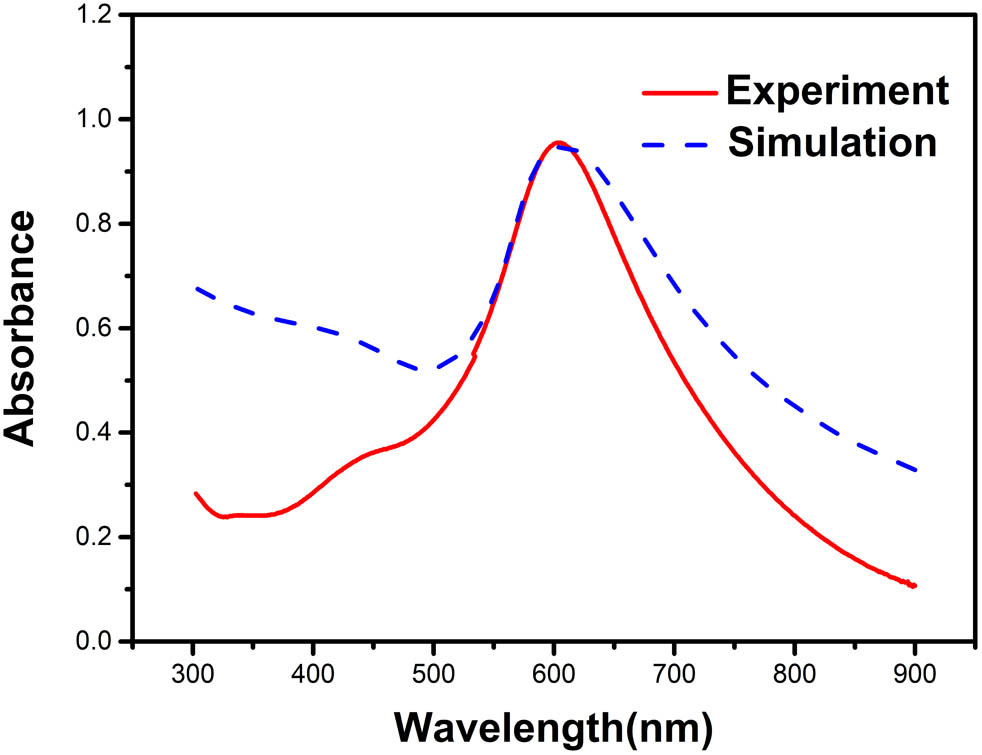
    Fig. 2. Linear absorption spectra of gold nanocages.
    Electric field distributions of gold nanocages with incident wavelength of (a) 600 nm and (b) 300 nm.
    Fig. 3. Electric field distributions of gold nanocages with incident wavelength of (a) 600 nm and (b) 300 nm.
    Open-aperture Z-scan curves for (a) gold nanocages at 550 nm and 300 μJ, (b) gold nanocages at 550 nm and 800 μJ, (c) gold nanocages at 600 nm and 300 μJ, (d) gold nanocages at 600 nm and 800 μJ, (e) gold nanocages at 650 nm and 300 μJ, and (f) gold nanocages at 650 nm and 800 μJ. The dots are experimental data, while the solid lines are the generated theoretical fit.
    Fig. 4. Open-aperture Z-scan curves for (a) gold nanocages at 550 nm and 300 μJ, (b) gold nanocages at 550 nm and 800 μJ, (c) gold nanocages at 600 nm and 300 μJ, (d) gold nanocages at 600 nm and 800 μJ, (e) gold nanocages at 650 nm and 300 μJ, and (f) gold nanocages at 650 nm and 800 μJ. The dots are experimental data, while the solid lines are the generated theoretical fit.
    Solid lines are the linear absorption spectra. The dots are saturation strength Is and nonlinear absorption coefficient β versus wavelength when I0 is (a) 4.95×10¹³ W/m2 and (b) and (c) 1.32×10¹⁴ W/m2.
    Fig. 5. Solid lines are the linear absorption spectra. The dots are saturation strength Is and nonlinear absorption coefficient β versus wavelength when I0 is (a) 4.95×10¹³W/m2 and (b) and (c) 1.32×10¹⁴W/m2.
    λ (nm)αns (m−1)α0 (m−1)I0 (W/m2)Is (W/m2)β (m/W)
    5506.38×1022.01×1014.95×10135.00×10120
    1.32×10141.33×10135.2×1012
    6001.84×1035.89×1024.95×10136.18×10120
    1.32×10141.89×10133.68×1012
    6509.01×1022.89×1014.95×10135.18×10120
    1.32×10141.68×10124.3×1012
    Table 1. Nonlinear Optical Parameters of Gold Nanocages
    Shuang Chen, Suying Yang, Yan Huang, Weiyan Jiao, Guanghua Fan, Yachen Gao. Wavelength-dependent nonlinear absorption of gold nanocages[J]. Chinese Optics Letters, 2020, 18(1): 011901
    Download Citation