The dipole resonances of gold nanocages were investigated theoretically using finite difference time domain method. The results show that field enhancement is obtained at the walls of the gold nanocages. It is believed that the effect can cause a strong optical nonlinear property. To test the hypothesis, nonlinear absorption was investigated using a broadband 5 ns Z scan. It was found that at low intensities the sample shows saturable absorption (SA), while at higher intensities a switch from SA to reverse SA occurs. Moreover, the nonlinear absorption of the sample is sensitively wavelength-dependent, and, in the resonant region, saturation intensity is the largest.
As an important part of nanomaterials, metal nanoparticles (especially gold and silver) have attracted more and more attention in recent years[1,2] and have been widely used in biological imaging[3,4], -switching[5], cancer hyperthermia[6,7], and so on. The excellent optical properties of noble metal nanoparticles are due to surface plasmon resonance (SPR). The effect makes noble metal nanoparticles have strong optical nonlinearity and fast response[8–11]. Unlike solid nanostructures, the plasmon resonance of hollow nanostructures is sensitive to the inner shell dimensions of the particles[12]. Among them, the gold nanocage has an SPR absorption peak covering 400–1200 nm and precise tuning ability to absorb light waves at the ‘optical window’[13]. In addition, gold nanocages are hollow, thin-walled, and porous, and have relative biological inertness[14]. It can be loaded with small molecules, enzymes, and drugs for medical diagnosis and drug carriers[15–17]. But up to now, nonlinear optical absorption properties of gold nanocages have been rarely reported[18]. In 2018, Chan et al. investigated nonlinear absorption properties of gold nanocages with nanosecond Z-scan experiments at a wavelength of 532 nm[18]. They found that gold nanocages exhibit a switch over from saturable absorption (SA) characteristics to reverse saturable absorption (RSA) with increasing input pump intensities. In fact, nonlinear optical properties are strongly wavelength-dependent. In this Letter, we investigate the dependence of the nonlinear absorption properties of gold nanocages on the excitation conditions (wavelength and energy) using a broadband open-aperture Z-scan technique.
The gold nanocages studied in our experiments were obtained from Nanjing XFNANO Materials Tech Co., Ltd. The geometries of the gold nanocages were acquired by using scanning electron microscopy (SEM). The ultraviolet−visible (UV−vis) absorption spectra of the gold nanocages were collected by using an optical spectrometer (Ocean Optics USB4000). The theoretical fitting of linear absorption was performed by using the finite difference time domain (FDTD) method.
The nonlinear absorption properties of gold nanocages were investigated by open-aperture Z scan[19]. A nanosecond neodymium-doped yttrium aluminum garnet (Nd:YAG) laser with a pulse duration of 6 ns and a repetition rate of 10 Hz and its optical parametric oscillator (OPO, Continuum, APE OPO) were used as laser sources to obtain a laser pulse with tunable wavelength. In Z-scan experiments, laser beam quality factor is close to 1. The laser beam was focused on a 2 mm quartz cuvette filled with aqueous solution of gold nanocages using a lens with a focal length of 20 cm. The mass concentration of the gold nanocages solution is 0.1 mg/mL, and the sample has relatively strong time stability. Because the thickness of the sample is less than the Rayleigh length, the sample satisfies the thin sample approximation. The laser beam waist diameter was obtained to be about 100 μm by using the blade method. The sample cuvette was fixed on a computer-controlled translation stage so that it can move accurately. The incident and transmitted beam energies were simultaneously measured by using two energy detectors, respectively. The detected signals were recorded by a computer.
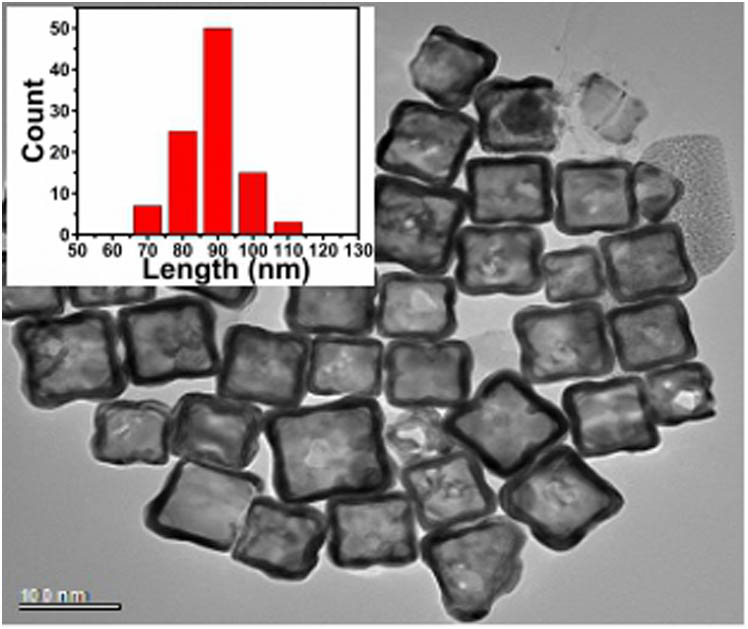
The geometry of gold nanocages is presented in Fig. 1, and the inset shows the distribution of the sample. It is obvious that gold nanocages have the characteristics of a hollow interior and thin wall. The length and the wall thickness of gold nanocages are measured to be 90 nm and 5 nm, respectively. The simulations were performed using the perfectly matched layer (PML) boundary condition. The dielectric constant of gold was acquired from Ref. [20]. The detailed description of FDTD can be found elsewhere[21]. Figure 2 is the optical absorption spectra of gold nanocages, and the solid line is the experimental data collected on a UV−vis spectrophotometer. The result shows that gold nanocages exhibit one absorption peak around 600 nm. The dotted line in Fig. 2 is the simulated absorption data of a single gold nanocage with the length and wall thickness of 90 nm and 5 nm, respectively. It can be seen that the simulation data agrees well with the experiment absorption spectra. As compared to the experimental data, it should be noted that there is a strong absorption in the simulation spectra around 300 nm. We believed that the angle of experimental preparation of gold nanocages is smooth, but the surface plasmon at around 300 nm is excited by the edge angle in the simulation model.
Figure 1.SEM image and size distribution of the gold nanocages (inset).
In order to clearly indentify the cause of plasma excitation in gold nanocages, the electric field distributions of gold nanocages at 600 nm and 300 nm were calculated, as shown in Figs. 3(a) and 3(b). The excitation light was incident vertically (z axis), and the electric field was parallel to the gold nanocage (y axis). Electric field distribution at different wavelengths was measured under different incident monochromatic light. In Fig. 3(a), we can see that field maximum points are located at walls of gold nanocages. This field distribution shows that the SPR at around 600 nm is caused by walls of gold nanocages. In Fig. 3(b), large field enhancements appearing at the tips can be seen. The result shows that the surface plasmon at 300 nm is excited by the tips of the gold nanocage.
Figure 3.Electric field distributions of gold nanocages with incident wavelength of (a) 600 nm and (b) 300 nm.
Fixed laser energy of 300 μJ and 800 μJ (irradiance at focus: is and ) was used for open-aperture Z-scan measurements. The input wavelengths were tuned to an extended spectral range from 550 nm to 650 nm. Here, we presented three representative curves; the samples were excited at 550 nm, 600 nm, and 650 nm in Figs. 4(a)–4(f).
Figure 4.Open-aperture Z-scan curves for (a) gold nanocages at 550 nm and 300 μJ, (b) gold nanocages at 550 nm and 800 μJ, (c) gold nanocages at 600 nm and 300 μJ, (d) gold nanocages at 600 nm and 800 μJ, (e) gold nanocages at 650 nm and 300 μJ, and (f) gold nanocages at 650 nm and 800 μJ. The dots are experimental data, while the solid lines are the generated theoretical fit.
As shown in Figs. 4(a), 4(c), and 4(e), when excitation energies are relatively weak (300 μJ), the gold nanocages exhibit obvious SA at three different wavelengths, which results in a higher transmittance at the focal point (). Specifically, at the focal point (600 nm), the transmittance of gold nanocages is the largest.
Then, with the increase in incident intensity (800 μJ), as shown in Figs. 4(b), 4(d), and 4(f), two symmetrical humps appear on both sides of a valley around the focal point, indicating the appearance of transformation from SA to RSA[11]. Specifically, at the focal point (600 nm), the magnitude of RSA is the smallest.
When irradiance is moderate, most of electrons are pumped to the excited state, resulting in a smaller number of the ground state, which is called bleaching of ground state plasmon[22]. So, when more light is transmitted in open-aperture Z-scan measurement, the ground state absorption of the sample decreases, which leads to SA in gold nanocages, as shown in Figs. 4(a), 4(c), and 4(e). As laser energy increases further, as shown in Figs. 4(b), 4(d), and 4(f), RSA dominating in gold nanocages was because of the free carrier absorption[23,24]. We believe that the strong difference in SA and RSA at different excitation wavelengths is caused by the SPR of gold nanocages. In Fig. 2, there is an SPR peak at around 600 nm, which makes the strongest SA and weakest RSA at 600 nm.
From the results above, we can find two composite nonlinear absorptions with opposite signs in gold nanocages. Theoretically, when there is a switch from SA to RSA, the absorption is defined as[25]where and are the linear limits of non-saturable absorption and saturable absorption, respectively. is the laser intensity, is the saturation intensity, and is the RSA coefficient. The change of laser intensity with optical distance can be expressed as where represents a short optical distance. Under appropriate initial conditions, the intensity radiation of Eq. (2) is solved numerically by the thin sample approximation method.
Then, by integrating the light intensity distribution on the exit surface of the sample, the transmittance of each position is obtained. Thus, the theoretical fit to the experimental data could be conducted by using Eqs. (1) and (2). As shown in Fig. 4 with solid lines, we can find that the theoretical fit is in good agreement with the experimental results. Optical nonlinear parameters are obtained and summarized in Table 1. But, we can also find that there is still a little difference between theoretical fit and experimental data. We think that this may be caused by nonlinear scattering[26,27].
λ (nm)
αns (m−1)
α0 (m−1)
I0 (W/m2)
Is (W/m2)
β (m/W)
550
6.38×10²
2.01×101
4.95×10¹³
5.00×10¹²
0
1.32×10¹⁴
1.33×10¹³
5.2×10⁻¹²
600
1.84×10³
5.89×10²
4.95×10¹³
6.18×10¹²
0
1.32×10¹⁴
1.89×10¹³
3.68×10⁻¹²
650
9.01×10²
2.89×101
4.95×10¹³
5.18×10¹²
0
1.32×10¹⁴
1.68×10¹²
4.3×10⁻¹²
Table 1. Nonlinear Optical Parameters of Gold Nanocages
In order to reflect intuitively the dependence of nonlinear absorption on wavelength and SPR, optical nonlinear parameters of and versus wavelength were provided using dots in Fig. 5. Linear absorption of gold nanocages was also given in the figure using solid lines for comparison. Figure 5 implied the how and why of nonlinear absorption being wavelength-dependent. The strong dependence of nonlinear absorption on the excitation wavelength and SPR can be intuitively seen. In Figs. 5(a) and 5(b), increases significantly when the excitation wavelength approaches the SPR peak of gold nanocages. But, in Fig. 5(c), it can be seen that decreases when the wavelength approaches the SPR peak. It is believed that the increase of saturation strength approaching the SPR is due to the resonant enhancement of nonlinear properties[28]. When excitation energies are relatively weak, the gold nanocages exhibit obvious SA. While the excitation wavelength approaches SPR, more electrons are pumped to the conduction band, which results in the decrease of ground state absorption of nanoparticles, and they have larger saturation strength. The decrease of the nonlinear absorption coefficient approaching SPR arises from the enhanced free carrier absorption.
Figure 5.Solid lines are the linear absorption spectra. The dots are saturation strength and nonlinear absorption coefficient versus wavelength when is (a) and (b) and (c) .
In conclusion, we have investigated the dipole resonances of gold nanocages by using absorption measurements and FDTD simulation. These results showed that the dipole resonances are located at about 600 nm, and large electric fields are confined at the walls of the gold nanocages, which makes large optical nonlinearities. We have investigated the nonlinear absorption of gold nanocages using broadband open Z-scan measurements. It was found that gold nanocages exhibit SA at low excitation intensities, and saturation intensity is the largest in the resonant region. A switch from SA to RSA was observed when the excitation intensity is increased. The experimental results were discussed in terms of the bleaching of ground state plasma and free carrier absorption.