
Da-wei YE, Fang DING, Ke-dong LI, Xia-hua CHEN, Yu LUO, Qing ZHANG, Ling-yi MENG, Guang-nan LUO. Study on Time Delay of Impurity Line Emissions Between in the Edge and Core Plasmas in EAST Tokamak[J]. Spectroscopy and Spectral Analysis, 2022, 42(11): 3507
- Spectroscopy and Spectral Analysis
- Vol. 42, Issue 11, 3507 (2022)
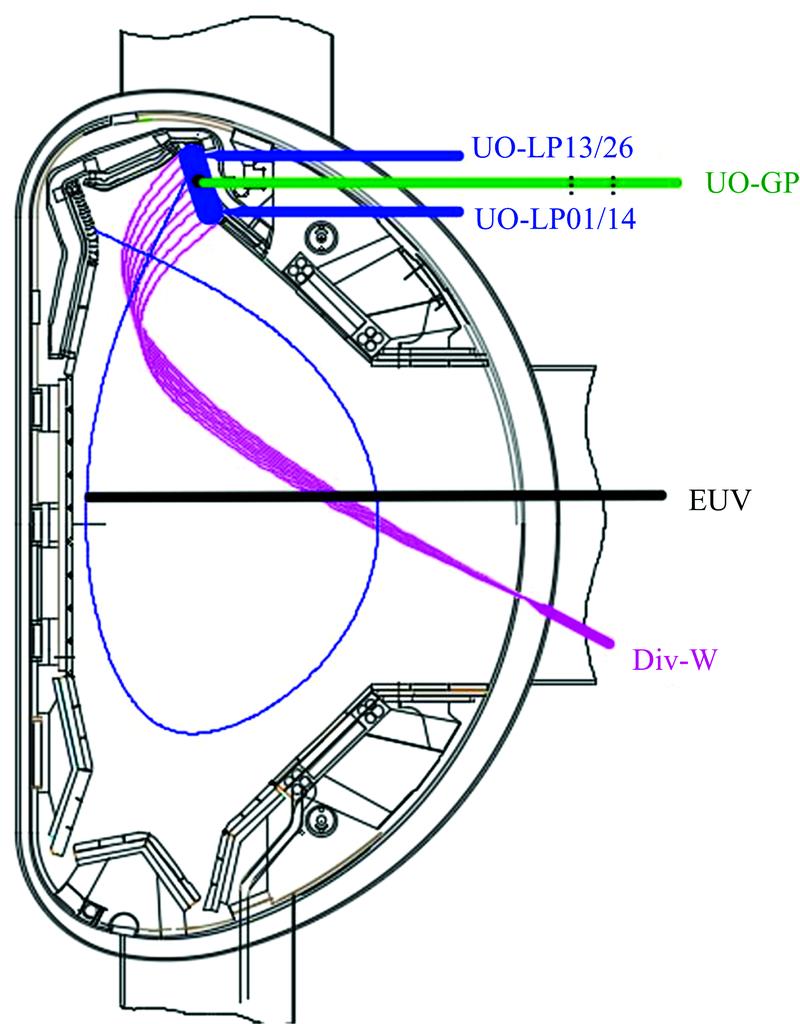
Fig. 1. Geometry of viewing chords for the relevant diagnostics on EAST
Div-W (magenta): divertor visible spectroscopy system viewing the upper outer(UO)tungsten divertor target; EUV (black): extreme ultraviolet spectrometer viewing the core plasma; UO-LP (blue): divertor Langmuir probes at the UO target; UO-GP (green): gas puff inlet at the UO target. A typical separatrix of the main plasma is also shown with the blue line
Div-W (magenta): divertor visible spectroscopy system viewing the upper outer(UO)tungsten divertor target; EUV (black): extreme ultraviolet spectrometer viewing the core plasma; UO-LP (blue): divertor Langmuir probes at the UO target; UO-GP (green): gas puff inlet at the UO target. A typical separatrix of the main plasma is also shown with the blue line
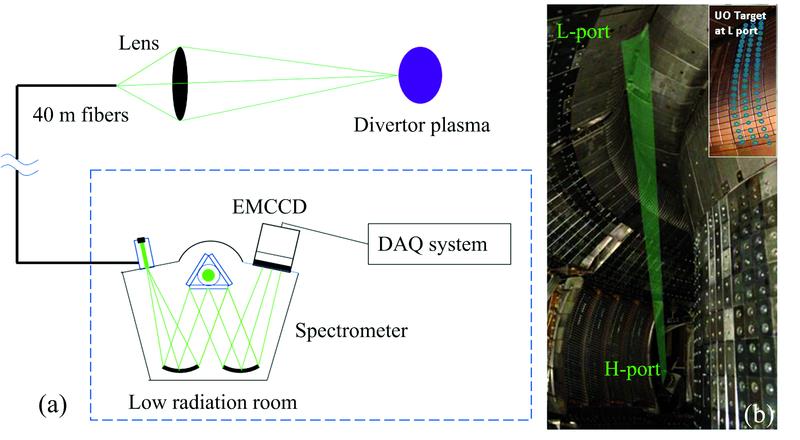
Fig. 2. Divertor visible spectroscopy system on EAST
(a): Schematic diagram of Div-W system; (b): Light path diagram viewing the UO divetor target in EAST vacuum chamber
(a): Schematic diagram of Div-W system; (b): Light path diagram viewing the UO divetor target in EAST vacuum chamber
Fig. 3. Typical spectra measured by divertor visible spectroscopy system
Fig. 4. (a): Temporal evolutions of Ar Ⅱ line emission from the upper divertor (black), Ar ⅩⅥ line emission from the core plasma (red) and the voltage signal of piezo valve for Ar seeding (magenta); (b): Correlation coefficient ρ as a function of shift time between the Ar ⅩⅥ and the Ar Ⅱ signal; The rising time period of the spectral lines [3~4.5 s indicated by the shaded area in Fig.4 (a)] is used to calculate the correlation coefficient
Fig. 5. Time traces of main plasma parameters of discharge #85263 and #85272
(a): Plasma currentI P; (b): Power of 4.6 GHz LHW (c): Ar Ⅱ line emission detected by Div-W, Ar ⅩⅥ line emission detected by EUV and the voltage signal of piezo valve for Ar seeding in shot #85263; (d): Ar Ⅱ emission detected by Div-W, Ar ⅩⅥ emission detected by EUV and the voltage signal of piezo valve for Ar seeding in shot #85272; (e): Electron temperature (T et) near the outer strike point of the upper divertor
(a): Plasma current
Fig. 6. (a): The correlation coefficient ρ between the Ar Ⅱ signal and the Ar ⅩⅥ signal as a function of shift time of two typical discharges (#85263 and #85272) with different 4.6 GHz LHW powers; (b): Scatter graph between the maximum correlation coefficient ρ and the corresponding delay time in the similar discharges except for with different 4.6 GHz LHW powers, red for P 4.6 GHz=1.5 MW and blue for P 4.6 GHz=2.5 MW

Set citation alerts for the article
Please enter your email address
© Copyright 2018-2021 | Chinese Laser Press. All Rights Reserved 沪ICP备15018463号-20