• Chinese Journal of Lasers
  • Vol. 47, Issue 2, 207039 (2020)
Shen Renqiang1, Wang Ling1、2、*, Xu Ming''en1、2, and Peng Shichang2
Author Affiliations
  • 1School of Automated, Hangzhou Dianzi University, Hangzhou, Zhejiang 310018, China
  • 2Zhejiang Provincial Key Laboratory of Medical Information and Three-Dimensional Bio-Printing, Hangzhou, Zhejiang 310018, China
  • show less
    DOI: 10.3788/CJL202047.0207039 Cite this Article Set citation alerts
    Shen Renqiang, Wang Ling, Xu Ming''en, Peng Shichang. Characterization of Cell Distribution Based on Optical Coherence Tomography Scattering[J]. Chinese Journal of Lasers, 2020, 47(2): 207039 Copy Citation Text show less
    Reconstruction process of scattering coefficient distribution image
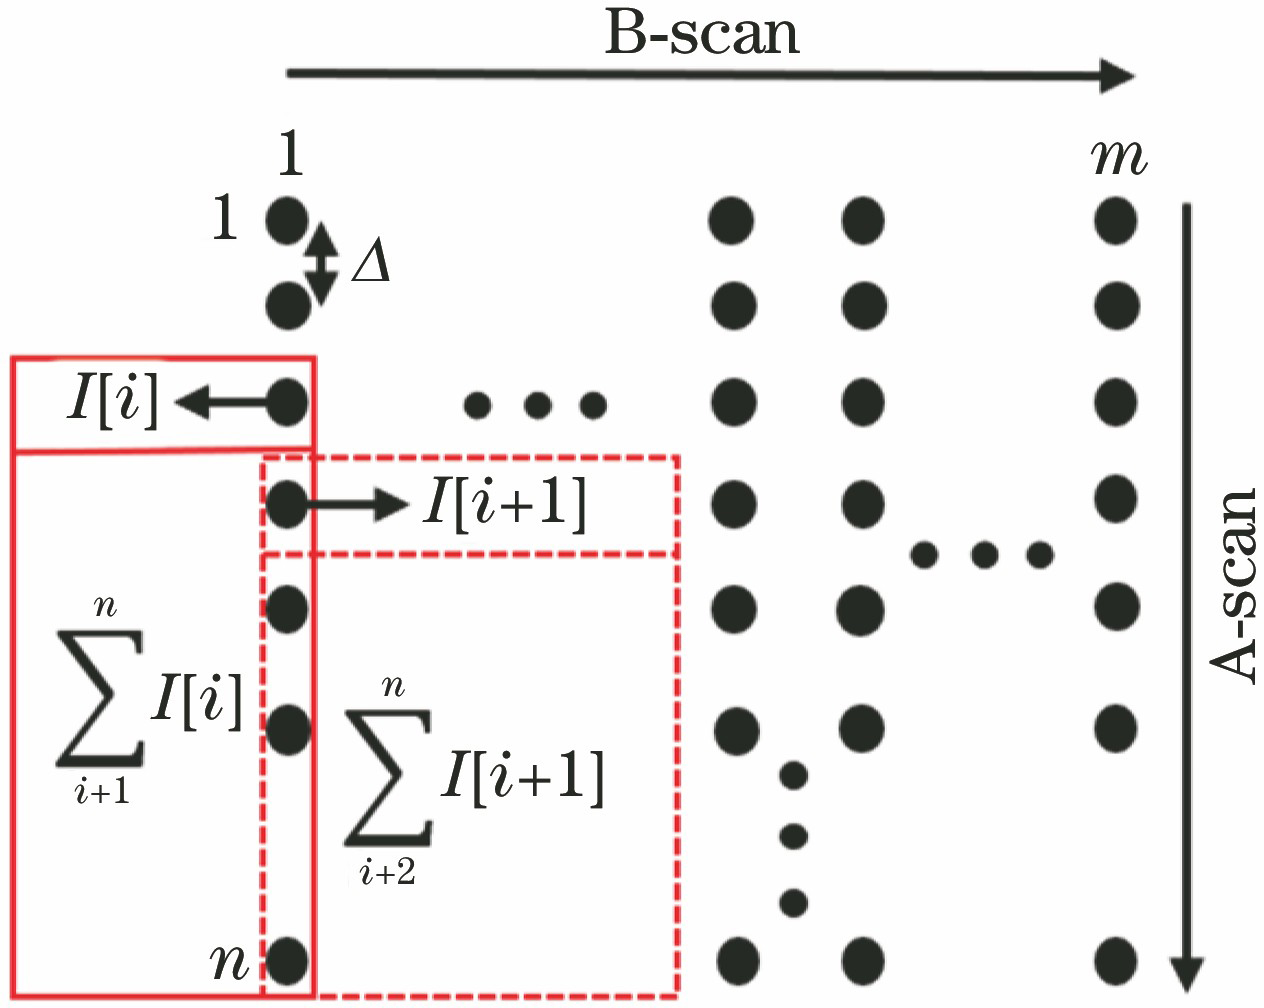
    Fig. 1. Reconstruction process of scattering coefficient distribution image
    OCT image and scattering coefficient distribution of the multilayer dielectric scattering model. (a) OCT intensity image; (b) scattering coefficient distribution calculated by the proposed method; (c) scattering curve corresponding to the model at the white dotted frame in Fig.2(b)
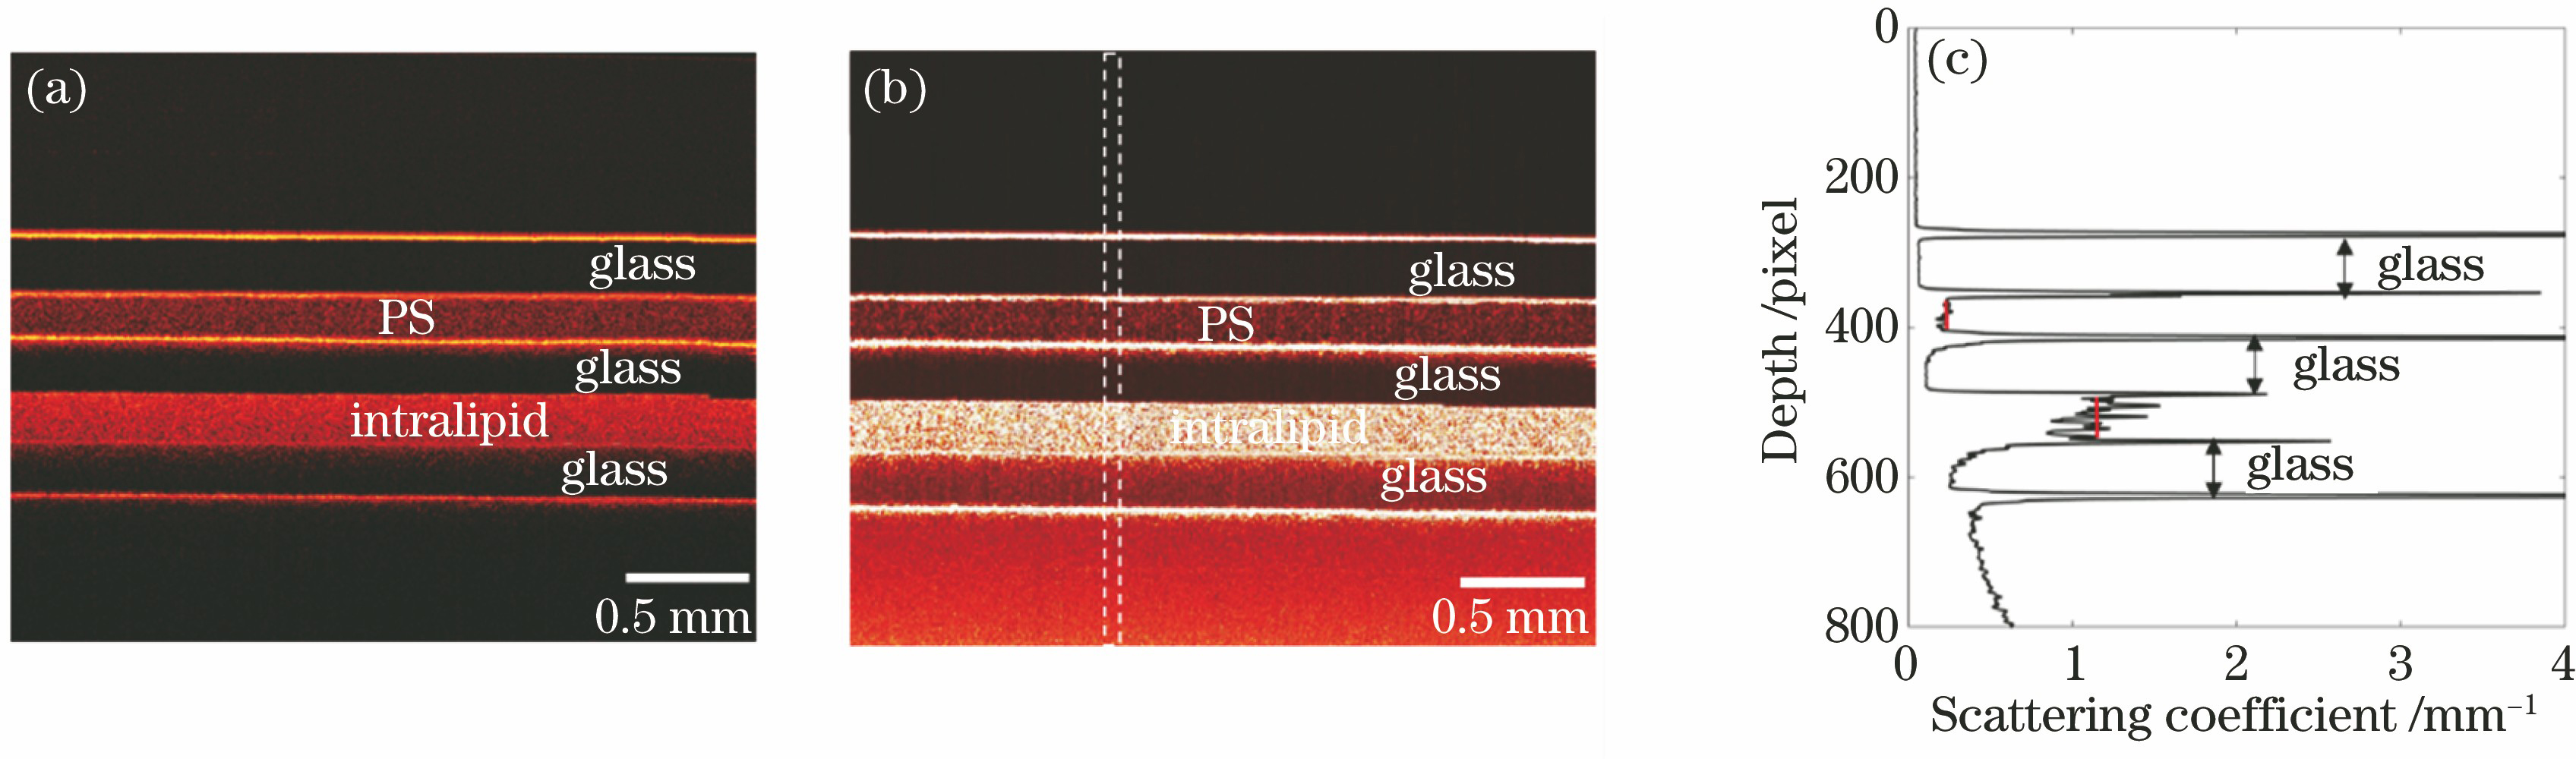
    Fig. 2. OCT image and scattering coefficient distribution of the multilayer dielectric scattering model. (a) OCT intensity image; (b) scattering coefficient distribution calculated by the proposed method; (c) scattering curve corresponding to the model at the white dotted frame in Fig.2(b)
    OCT intensity images and scattering images of C3A cell suspension with different concentrations. (a1)-(a4) OCT intensity images; (b1)-(b4) OCT scattering images
    Fig. 3. OCT intensity images and scattering images of C3A cell suspension with different concentrations. (a1)-(a4) OCT intensity images; (b1)-(b4) OCT scattering images
    Frequency distribution histograms of OCT intensity and scattering coefficient for cell suspension with different concentrations. (a1)-(a4) Signal intensity; (b1)-(b4) scattering coefficient
    Fig. 4. Frequency distribution histograms of OCT intensity and scattering coefficient for cell suspension with different concentrations. (a1)-(a4) Signal intensity; (b1)-(b4) scattering coefficient
    Relationship between the parameters of the maximum frequency of the distribution histograms and the cell concentration. (a) Relationship between intensity and cell concentration; (b) relationship among scattering coefficient, distance between background peak and cell characteristic peak, and cell concentration
    Fig. 5. Relationship between the parameters of the maximum frequency of the distribution histograms and the cell concentration. (a) Relationship between intensity and cell concentration; (b) relationship among scattering coefficient, distance between background peak and cell characteristic peak, and cell concentration
    OCT intensity images and scattering images of cell-free and cell-containing hydrogel scaffolds. (a1) OCT intensity image of cell-free scaffold; (a2) OCT intensity image of cell-containing scaffold; (b1) scattering image of cell-free scaffold; (b2) scattering image of cell-containing scaffold
    Fig. 6. OCT intensity images and scattering images of cell-free and cell-containing hydrogel scaffolds. (a1) OCT intensity image of cell-free scaffold; (a2) OCT intensity image of cell-containing scaffold; (b1) scattering image of cell-free scaffold; (b2) scattering image of cell-containing scaffold
    Histogram of signal intensity and scattering coefficient of hydrogel scaffold. (a) Intensity distribution of the PBS buffer solution; (b) intensity distribution of cell-free scaffold; (c) intensity distribution of cell-containing scaffold; (d) scattering corefficient distribution of PBS buffer solution; (e) scattering corefficient distribution of cell-free scaffold; (f) Scattering corefficient distribution cell-containing scaffold
    Fig. 7. Histogram of signal intensity and scattering coefficient of hydrogel scaffold. (a) Intensity distribution of the PBS buffer solution; (b) intensity distribution of cell-free scaffold; (c) intensity distribution of cell-containing scaffold; (d) scattering corefficient distribution of PBS buffer solution; (e) scattering corefficient distribution of cell-free scaffold; (f) Scattering corefficient distribution cell-containing scaffold
    Comparison of OCT intensity images, scattering images and H&E stained sections for hydrogel scaffolds. (a1) OCT intensity image of cell-free hydrogel scaffold; (a2) OCT intensity image of cell-containing hydrogel scaffold; (b1) scattering image of cell-free hydrogel scaffold; (b2) scattering image of cell-containing hydrogel scaffold; (c1) stained sections image of cell-free hydrogel scaffold; (c2) stained sections image of cell-containing hydrogel scaffold
    Fig. 8. Comparison of OCT intensity images, scattering images and H&E stained sections for hydrogel scaffolds. (a1) OCT intensity image of cell-free hydrogel scaffold; (a2) OCT intensity image of cell-containing hydrogel scaffold; (b1) scattering image of cell-free hydrogel scaffold; (b2) scattering image of cell-containing hydrogel scaffold; (c1) stained sections image of cell-free hydrogel scaffold; (c2) stained sections image of cell-containing hydrogel scaffold
    SampleIntensity /dBScattering coefficient μs/mm-1
    Background peakCharacteristic peak
    PBS buffer solution28.7500(0.0000)0.1700(0.0000)0.0000(0.0000)
    Cell-free hydrogel scaffold29.2500(0.0000)0.1150(0.0070)0.2150(0.0070)
    Cell-containing hydrogel scaffold29.2500(0.0000)0.1125(0.0050)0.2700(0.0294)
    Table 1. Intensity and scattering coefficient, and their standard deviation at the peak of frequency of histogram
    Shen Renqiang, Wang Ling, Xu Ming''en, Peng Shichang. Characterization of Cell Distribution Based on Optical Coherence Tomography Scattering[J]. Chinese Journal of Lasers, 2020, 47(2): 207039
    Download Citation