• Chinese Optics Letters
  • Vol. 21, Issue 4, 041901 (2023)
Dongyi Shen1, Guolin Zhao1, Xianfeng Chen1, and Wenjie Wan1、2、*
Author Affiliations
  • 1School of Physics and Astronomy, Shanghai Jiao Tong University, Shanghai 200240, China
  • 2University of Michigan-Shanghai Jiao Tong University Joint Institute, Shanghai Jiao Tong University, Shanghai 200240, China
  • show less
    DOI: 10.3788/COL202321.041901 Cite this Article Set citation alerts
    Dongyi Shen, Guolin Zhao, Xianfeng Chen, Wenjie Wan. Smith–Purcell radiation-like photoacoustic phased array[J]. Chinese Optics Letters, 2023, 21(4): 041901 Copy Citation Text show less
    Schematic of SPR-like photoacoustic phased array in a degraded form. (a) SPR-like photoacoustic phased array in a degraded form; the sequentially (1→4) excited laser-shock array emits acoustic radiation into the far field. (b) Upper, the resultant multiple propagating wavefronts from the procedure in (a); integers 1→4 denote each source and every wavefront in time sequence (indicated by the color). Lower, the effective quasi-phase line (dashed, normal to OL1 and OL2) depicts the angle dependence in the broadband SPR-like pattern in (b). By the moment when the detector captures the first shock front (blue) from source O, the secondary shock front from source A propagates to the detector. The delay time (Δt) for the detector to catch the later shock wave varies with the detection angle; accordingly, the received frequency is also changed.
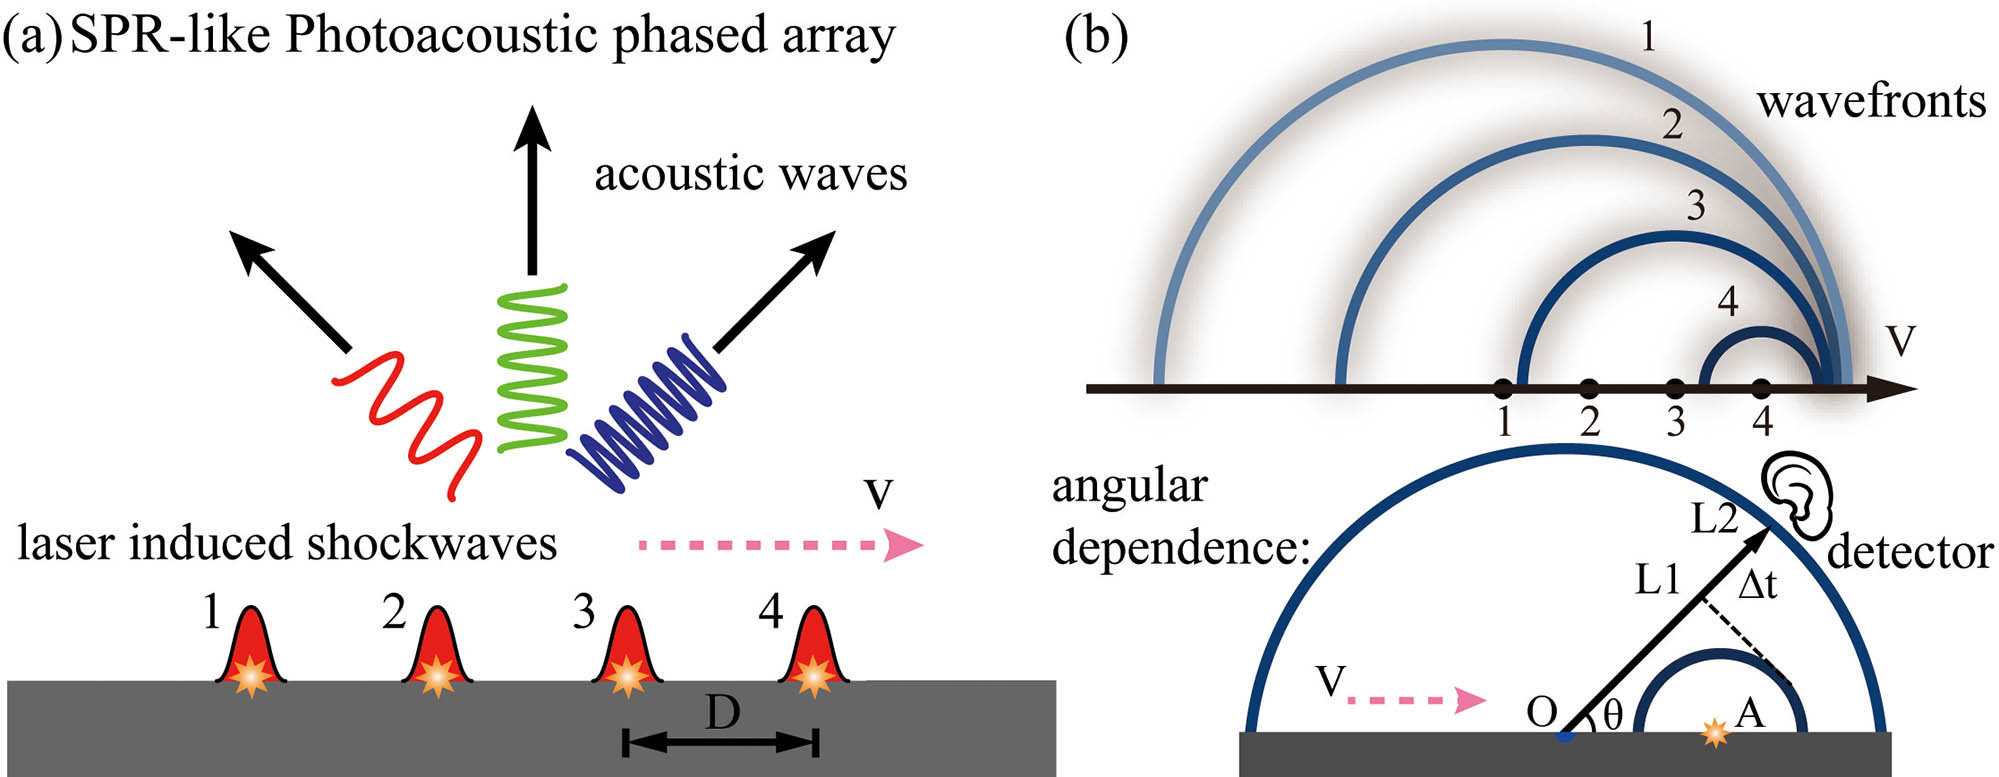
    Fig. 1. Schematic of SPR-like photoacoustic phased array in a degraded form. (a) SPR-like photoacoustic phased array in a degraded form; the sequentially (1→4) excited laser-shock array emits acoustic radiation into the far field. (b) Upper, the resultant multiple propagating wavefronts from the procedure in (a); integers 1→4 denote each source and every wavefront in time sequence (indicated by the color). Lower, the effective quasi-phase line (dashed, normal to OL1 and OL2) depicts the angle dependence in the broadband SPR-like pattern in (b). By the moment when the detector captures the first shock front (blue) from source O, the secondary shock front from source A propagates to the detector. The delay time (Δt) for the detector to catch the later shock wave varies with the detection angle; accordingly, the received frequency is also changed.
    Experimental observation of SPR-like photoacoustic radiation from a linear phased array in the far field. (a) Given a rotating mirror with a stable angular speed ω, the pump is scanned and focused onto the target alumina plate sequentially in the order a0→a1→a2, forming an effective laser-induced plasma shock wave phased array. The detector is placed r = 0.1 m from the array center O. The detector acquires the SPR signals also in the order b0→b1→b2. For a fixed detection angle θ and rotating ω, the time delay Δt remains unchanged and irrelevant to the detector’s distance in the far field. (b) Snapshot of such an SPR-like linear phased array by laser-induced plasma; the periodicity D is about 6.57 mm. (c) Measured real-time temporal signal and (d) its corresponding spectrum with a peak frequency at 10.58 kHz. The signal is collected and processed at a surface scanning speed of 10 m/s (effective periodicity ∼1 mm) at θ = 0°.
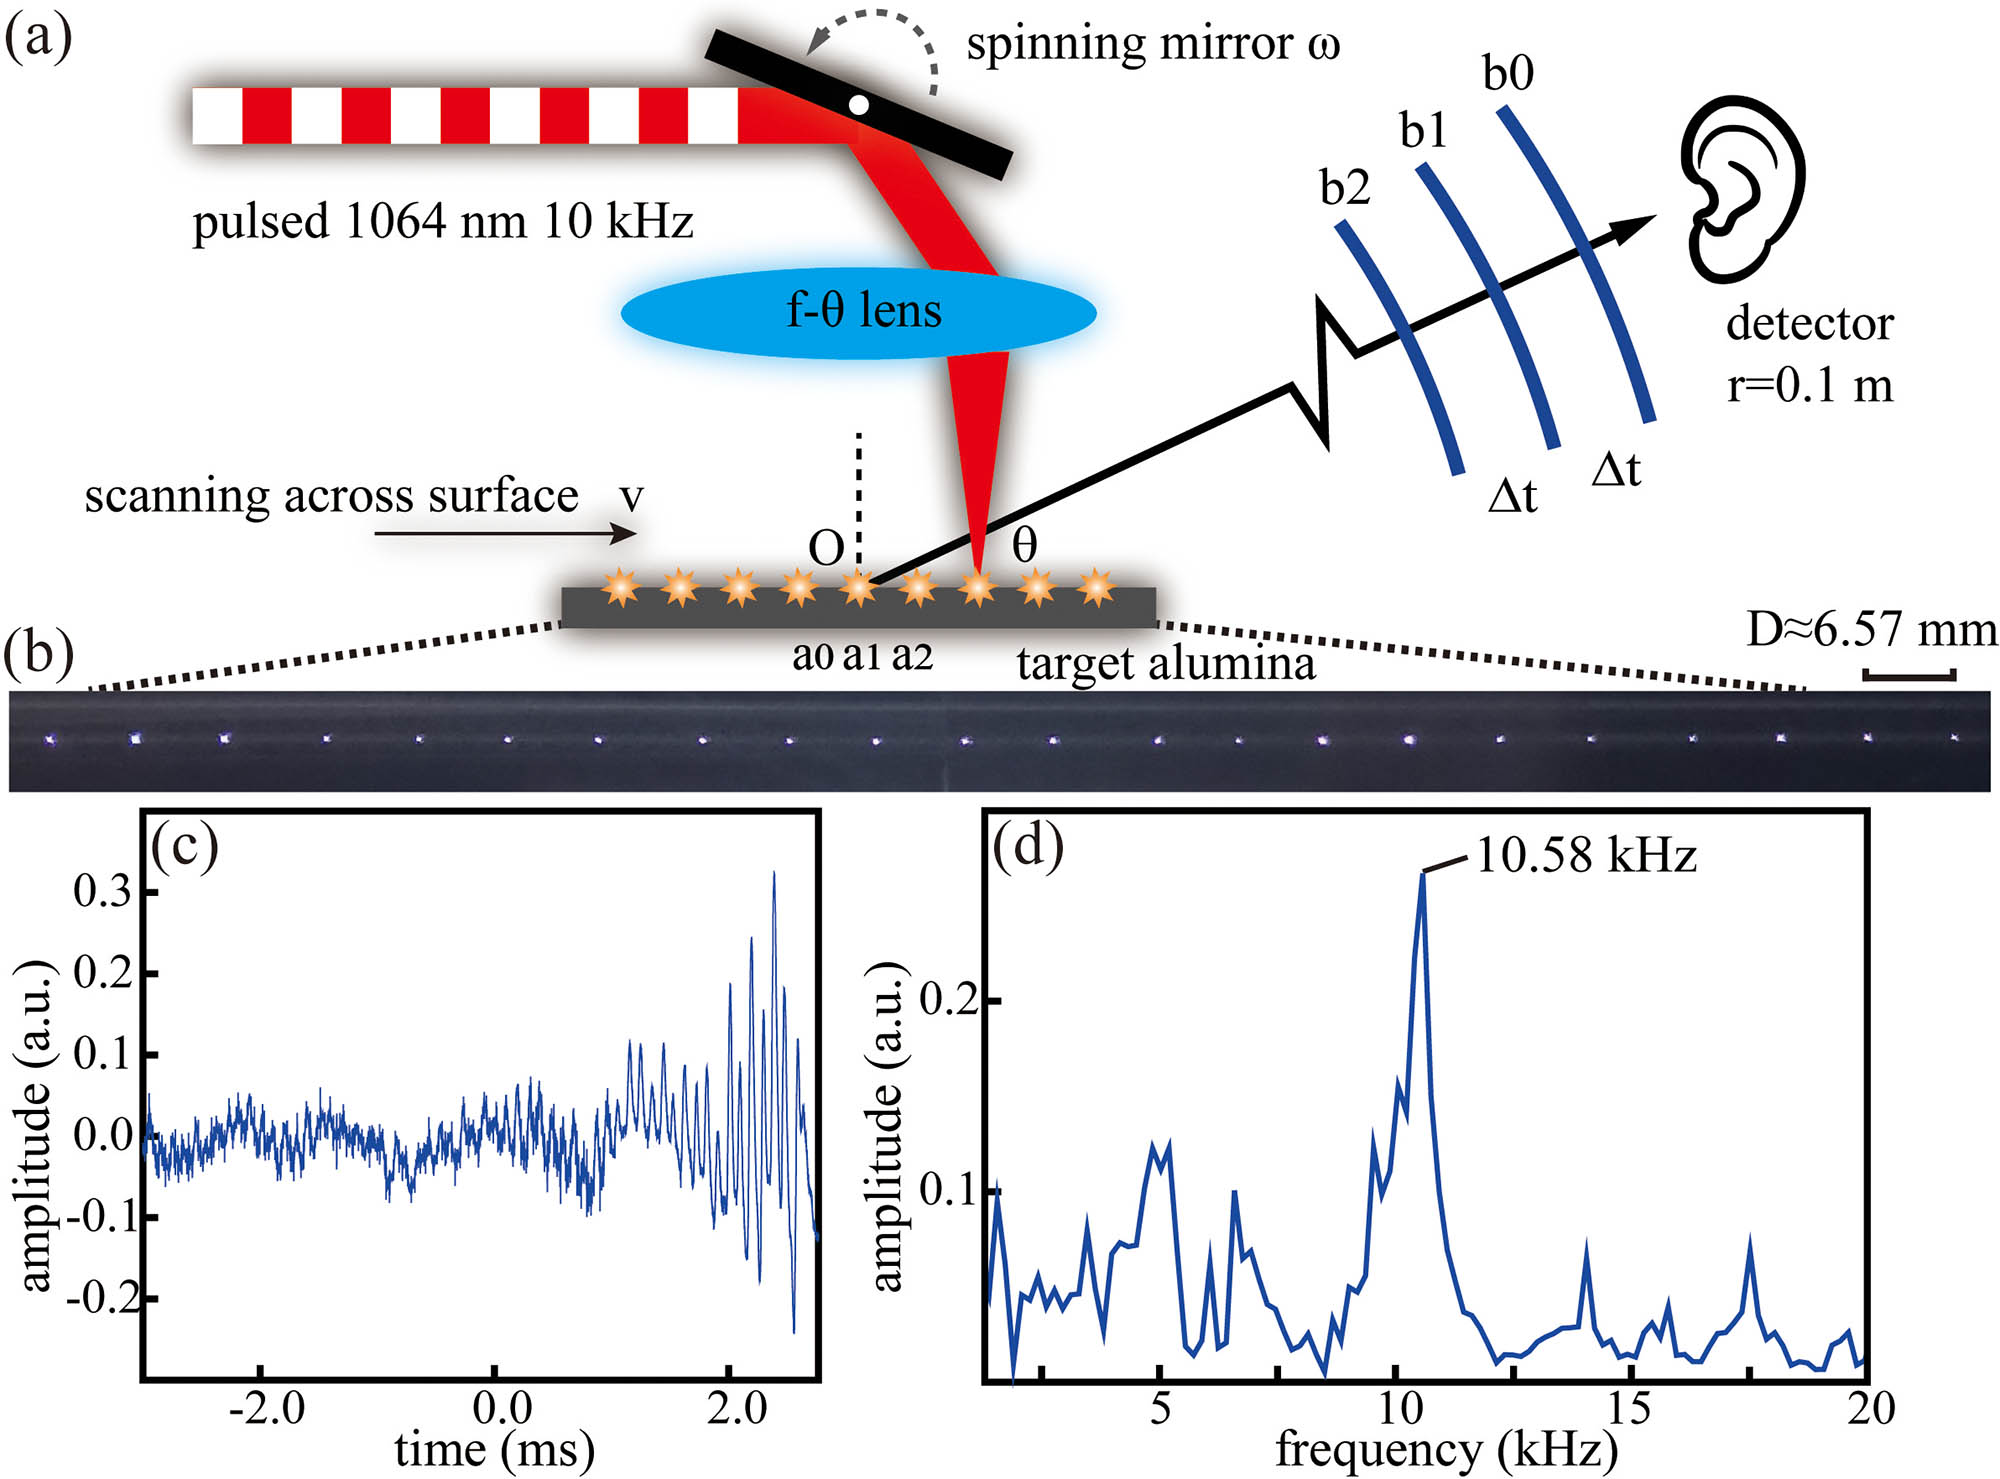
    Fig. 2. Experimental observation of SPR-like photoacoustic radiation from a linear phased array in the far field. (a) Given a rotating mirror with a stable angular speed ω, the pump is scanned and focused onto the target alumina plate sequentially in the order a0→a1→a2, forming an effective laser-induced plasma shock wave phased array. The detector is placed r = 0.1 m from the array center O. The detector acquires the SPR signals also in the order b0→b1→b2. For a fixed detection angle θ and rotating ω, the time delay Δt remains unchanged and irrelevant to the detector’s distance in the far field. (b) Snapshot of such an SPR-like linear phased array by laser-induced plasma; the periodicity D is about 6.57 mm. (c) Measured real-time temporal signal and (d) its corresponding spectrum with a peak frequency at 10.58 kHz. The signal is collected and processed at a surface scanning speed of 10 m/s (effective periodicity ∼1 mm) at θ = 0°.
    Angular and velocity dependence of the phased array emission in the far field. (a) and (b) testify to the velocity-dependent frequency with fixed detection angles 0° and 30°, respectively. Insets in (a) and (b) are the spectrum collected under the condition with surface velocity 65.7 m/s (effective grating period 6.57 mm) and 140.1 m/s (effective grating period 14.01 mm). (c) and (d) demonstrate the angular dependence in the photoacoustic SPR specially picked at surface velocities of 65.7 m/s and 140.1 m/s. The dots are experimental measurements, and the solid lines are the theoretical curves calculated by Eq. (1).
    Fig. 3. Angular and velocity dependence of the phased array emission in the far field. (a) and (b) testify to the velocity-dependent frequency with fixed detection angles 0° and 30°, respectively. Insets in (a) and (b) are the spectrum collected under the condition with surface velocity 65.7 m/s (effective grating period 6.57 mm) and 140.1 m/s (effective grating period 14.01 mm). (c) and (d) demonstrate the angular dependence in the photoacoustic SPR specially picked at surface velocities of 65.7 m/s and 140.1 m/s. The dots are experimental measurements, and the solid lines are the theoretical curves calculated by Eq. (1).
    Experimental (solid blue) and theoretical (black) radiation spectra at (a) θ = 0° and (b) θ = 30°; (a) N = 25 (number of acoustic sources on the target), vs = 65.7 m/s, θ = 0°; (b) N = 11, vs = 140.1 m/s, θ = 30°. The directly detected temporal signals are averaged 128 times before fast Fourier transform (FFT) processing into experimental data via an oscilloscope. Note that the dashed black curves (r = 0.1 m) are calculated by directly summing up all the phase-delayed acoustic sources and gathering radiated acoustic pressure amplitude at given conditions. The detection angle θ for r = 0.1 m calculation is defined from the center of the array.
    Fig. 4. Experimental (solid blue) and theoretical (black) radiation spectra at (a) θ = 0° and (b) θ = 30°; (a) N = 25 (number of acoustic sources on the target), vs = 65.7 m/s, θ = 0°; (b) N = 11, vs = 140.1 m/s, θ = 30°. The directly detected temporal signals are averaged 128 times before fast Fourier transform (FFT) processing into experimental data via an oscilloscope. Note that the dashed black curves (r = 0.1 m) are calculated by directly summing up all the phase-delayed acoustic sources and gathering radiated acoustic pressure amplitude at given conditions. The detection angle θ for r = 0.1 m calculation is defined from the center of the array.
    Dongyi Shen, Guolin Zhao, Xianfeng Chen, Wenjie Wan. Smith–Purcell radiation-like photoacoustic phased array[J]. Chinese Optics Letters, 2023, 21(4): 041901
    Download Citation