
Jiaqi Zhu, He Zhu, Mengjuan Liu, Yao Wang, Hanlun Xu, Nasir Ali, Huiyong Deng, Zhiyong Tan, Juncheng Cao, Ning Dai, Huizhen Wu, "Ultrabroadband and multiband infrared/terahertz photodetectors with high sensitivity," Photonics Res. 9, 2167 (2021)
- Photonics Research
- Vol. 9, Issue 11, 2167 (2021)
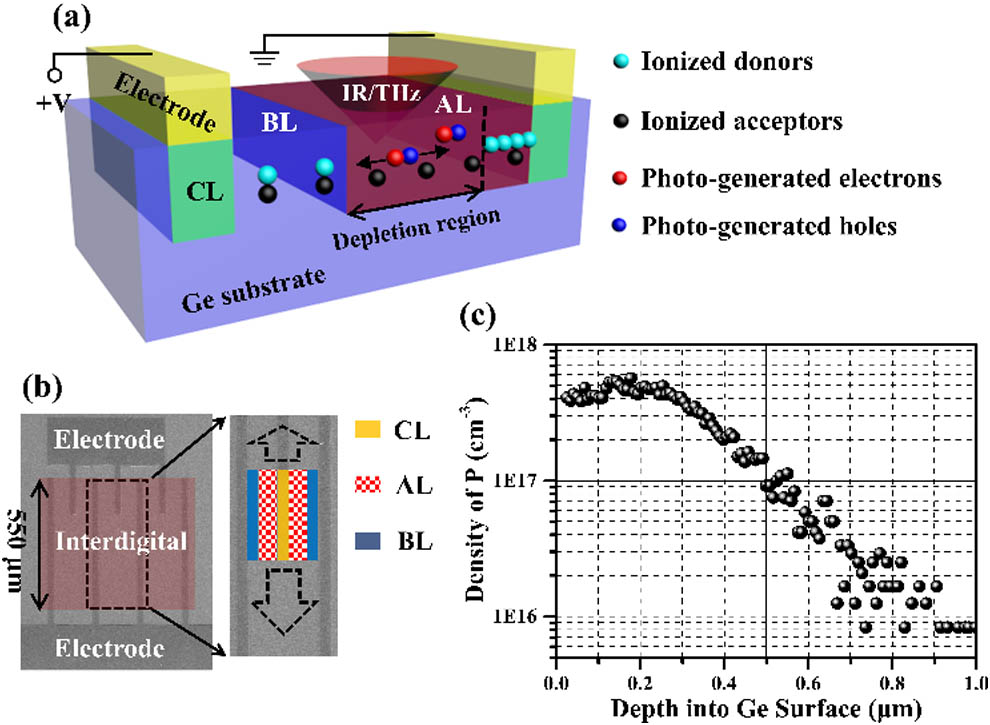
Fig. 1. (a) Schematic for the Ge:P BIB detectors. (b) Partly false-color SEM image for a unit of the detectors; inset: two magnified interdigital cells. (c) The density profile of P atoms in the AL, which was obtained by SIMS measurement.
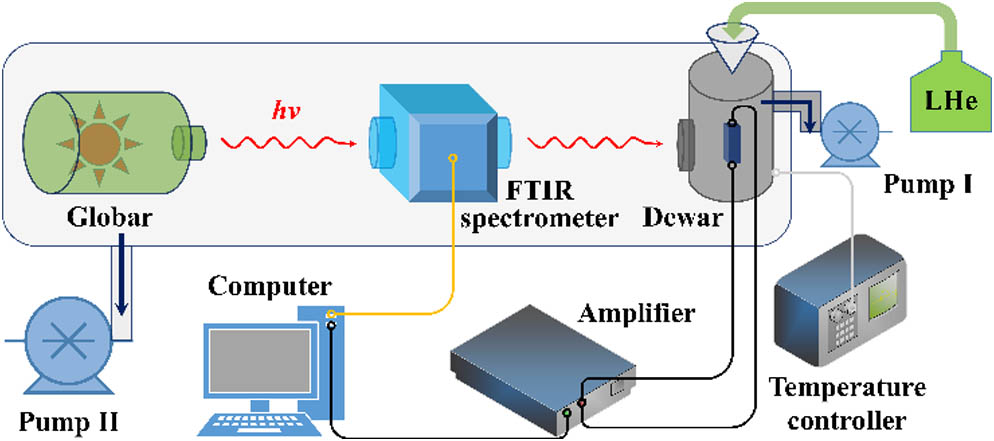
Fig. 2. Schematic of the measurement setup for response spectra.
Fig. 3. Response spectra of detectors (a) #1 and (b) #2 at different biases and 4.5 K. (c) and (d) Peak intensities of the two bands and their ratio versus bias for the spectra in (a) and (b), respectively, where R p R p ( IR ) / R p ( THz ) D + A −
Fig. 4. (a) Response spectra of detector #3 at different biases and 4.5 K, where the THz response band is left out for all of the spectra with above-150 mV biases since the intensity of this band already saturates; inset: magnified spectra within 3–4.2 μm for all biases. (b) Peak intensity of the IR band versus bias for the spectra in (a). (c) Response spectra at different temperatures and 400 mV of detector #3. (d) Peak intensity of the IR band versus temperature for the spectra in (c).
Fig. 5. Schematic of the measurement setup for blackbody responses.
Fig. 6. (a) Relative response spectrum of detector #1 measured at 4.5 K and 150 mV, where the HDPE window was used as a low-pass filter. (b)–(d) Blackbody responsivities versus bias at different temperatures for the three detectors, respectively. (e) Dark I-V characteristics for the three detectors at 4.5 K.
|
Table 1. Structural Parameters of the Fabricated Detectors
|
Table 2. Performance for Some Common Types of Multiband (or Broadband) IR or THz Detectors


Set citation alerts for the article
Please enter your email address

© Copyright 2018-2021 | Chinese Laser Press. All Rights Reserved 沪ICP备15018463号-20