
Huibin Lai, Mingxia He, Tian Tian, Longling Sun. Porosity of Tablets Based on Terahertz Spectroscopy[J]. Acta Optica Sinica, 2018, 38(6): 0630001
- Acta Optica Sinica
- Vol. 38, Issue 6, 0630001 (2018)
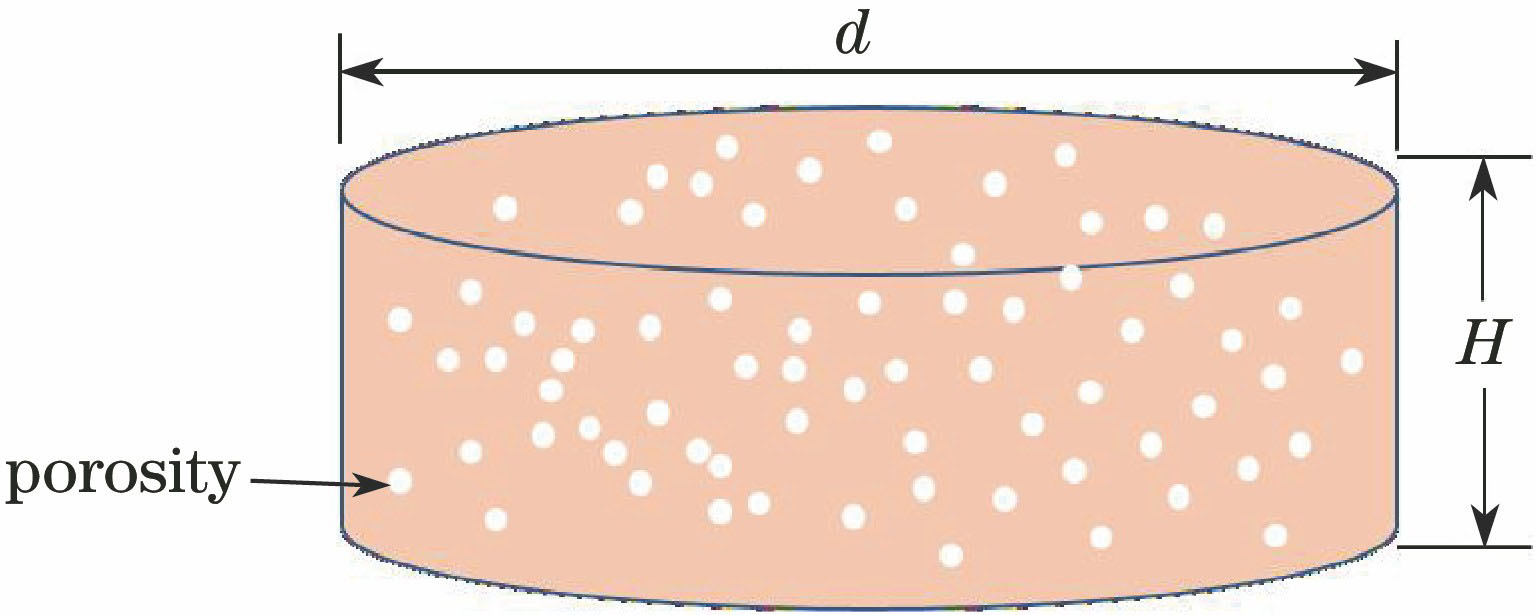
Fig. 1. Schematic of porous tablet
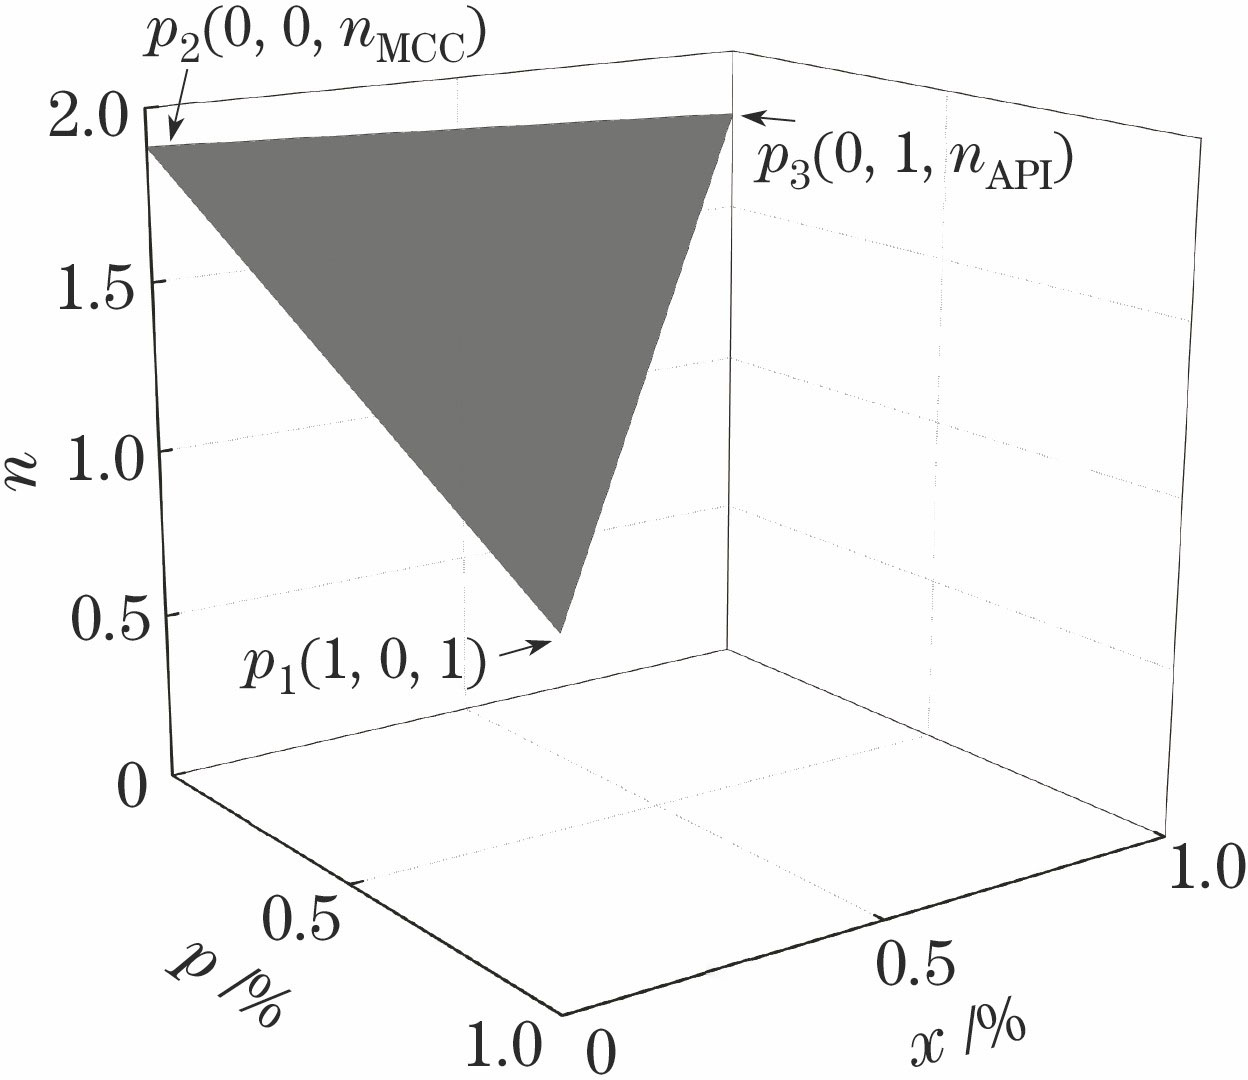
Fig. 2. Simulated mathematical model showing the relationship between porosity of tablets, mass fractions of different compositions and refractive index
Fig. 3. Terahertz pulse signals of tablet. (a) Time-domain spectra; (b) frequency-domain spectra
Fig. 4. (a) Experimental results of refractive index and thickness of tablets in the first group; (b) experimental results of refractive index and porosity of tablets in the second group; (c) experimental results of refractive index and API mass fraction of tablets in the third group
Fig. 5. Refractive indexes of MCC and API obtained by linear extrapolation when porosity is zero. (a) Refractive indexes of MCC and API obtained by the third group data when the mass fraction of API is 7.1%; (b) refractive indexes of MCC and API when porosity is zero
Fig. 6. Calculated and experimental porosities of tablets. (a) The first group; (b) the second group; (c) the third group
|
Table 1. Parameters of tablets with different thicknesses in the first group
|
Table 2. Parameters of tablets with different porosities in the second group
|
Table 3. Parameters of tablets with different API mass fractions in the third group
| |||||||||||
Table 4. Theoretical and experimental changes of refractive index obtained by changing porosity and API mass fraction respectively

Set citation alerts for the article
Please enter your email address
© Copyright 2018-2021 | Chinese Laser Press. All Rights Reserved 沪ICP备15018463号-20