
Kailong Zhang, Li Qian, Chunlei Zhu. Defect Detection in Mirror-Like Surface Based on Phase Measuring Deflectometry[J]. Laser & Optoelectronics Progress, 2022, 59(5): 0512004
- Laser & Optoelectronics Progress
- Vol. 59, Issue 5, 0512004 (2022)
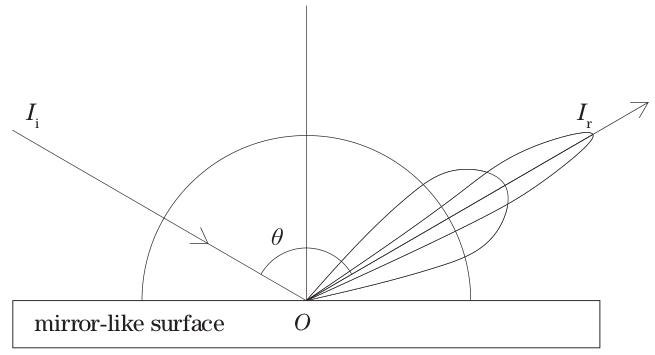
Fig. 1. Schematic diagram of the Nayar reflection model
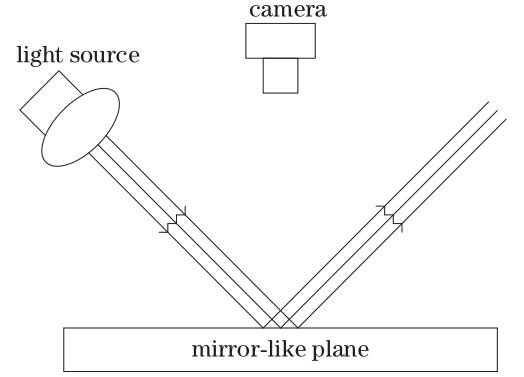
Fig. 2. Schematic diagram of the dark-field illumination of mirror-like plane
Fig. 3. Schematic diagram of the dark-field illumination of mirror-like surface
Fig. 4. Schematic diagram of the PMD
Fig. 5. Image to be measured
Fig. 6. Average gray scale of 4 phase-shifted images
Fig. 7. Average curve of gray projection. (a) Horizontal projection curve; (b) vertical projection curve
Fig. 8. Average differential curve of the gray projection. (a) Horizontal projection curve; (b) vertical projection curve
Fig. 9. Interception results of the area to be measured
Fig. 10. Absolute phase difference diagram
Fig. 11. Result of the frequency domain processing
Fig. 12. Defect area
Fig. 13. Parts to be measured
Fig. 14. Imaging results of different methods. (a) Traditional way; (b) sine structured light
Fig. 15. Physical image of the detection device
Fig. 16. Detection results of multiple defects. (a) Scratch; (b) smudge; (c) hair; (d) bruise; (e) bump

Set citation alerts for the article
Please enter your email address
© Copyright 2018-2021 | Chinese Laser Press. All Rights Reserved 沪ICP备15018463号-20