
Tianfu Yao, Chenchen Fan, Hu Xiao, LiangJin Huang, Jinyong Leng, Pu Zhou. [J]. Infrared and Laser Engineering, 2022, 51(6): 20220293
- Infrared and Laser Engineering
- Vol. 51, Issue 6, 20220293 (2022)
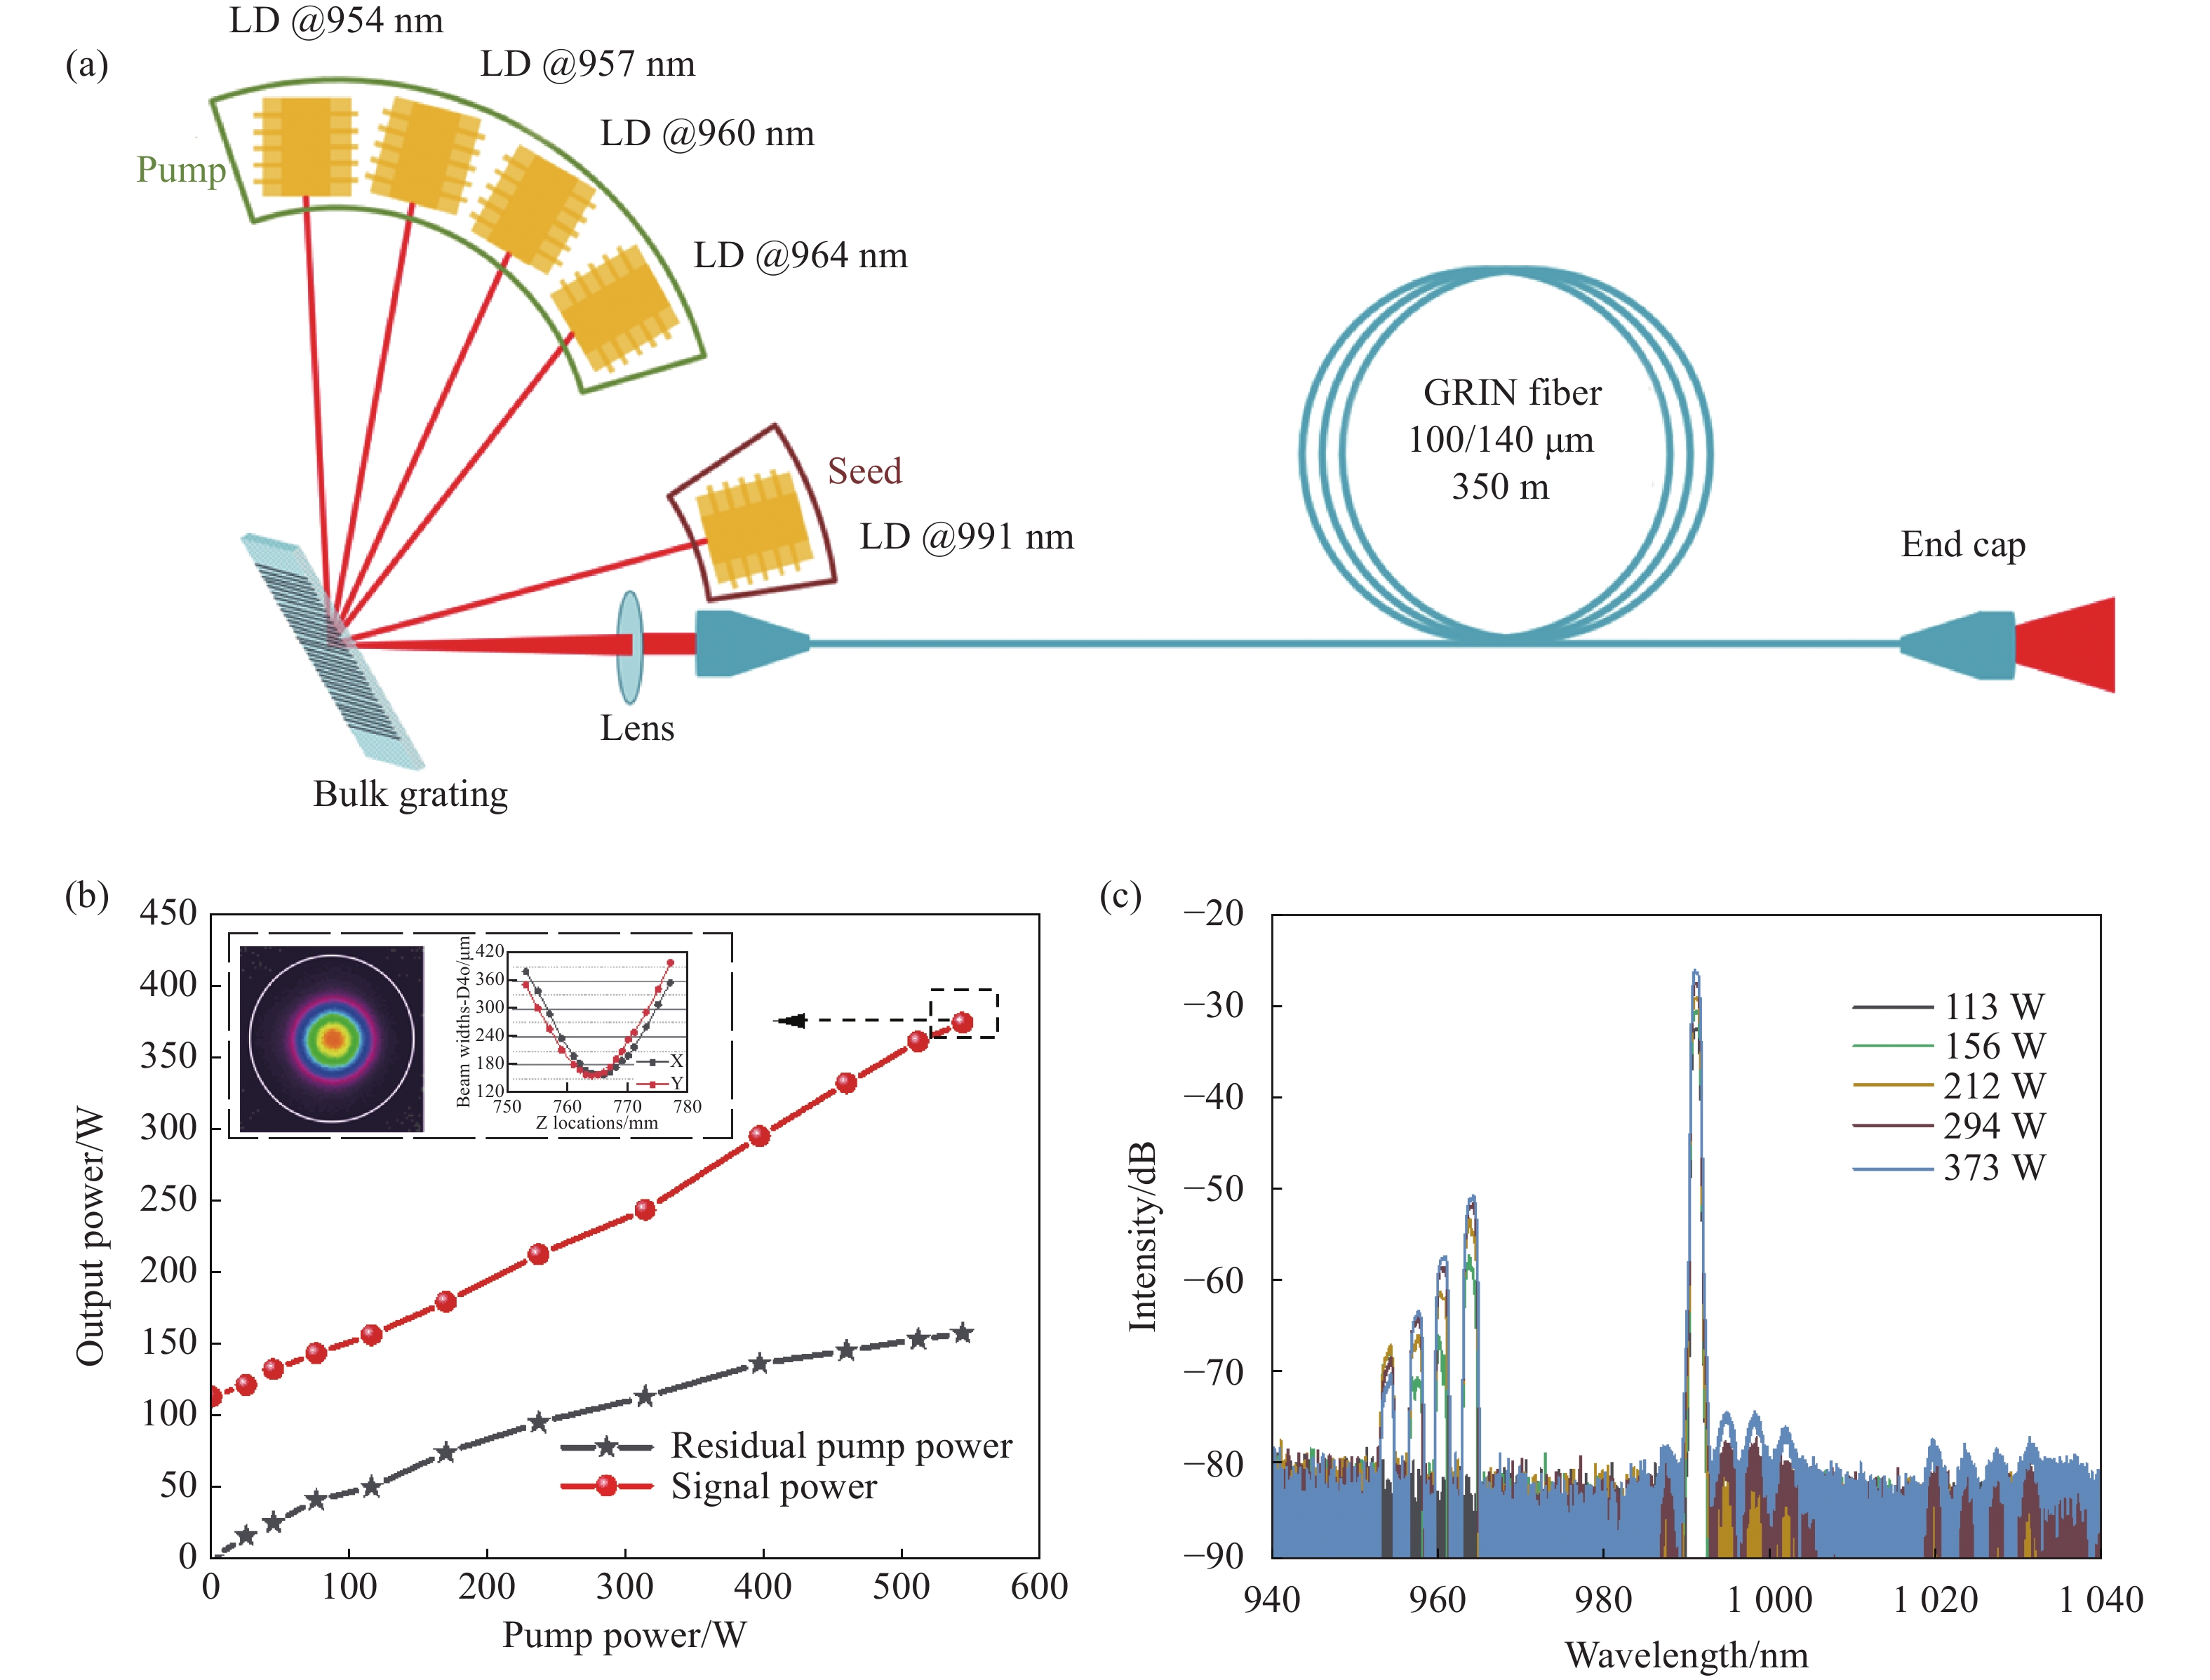
Fig. 1. (a) Schematic of experimental setup of LD pumped RFA; (b) RFA output power and residual pump power versus input pump power (left inset: beam profile at focal point, right inset: beam quality parameter M 2 measurement result); (c) Output spectrum evolution at different signal laser power levels


Set citation alerts for the article
Please enter your email address

© Copyright 2018-2021 | Chinese Laser Press. All Rights Reserved 沪ICP备15018463号-20