
Lei Deng, Guihua Liu, Hao Deng, Ling Cao. Gamma-Ray Noise Removal Based on Video Time Series Correlation[J]. Laser & Optoelectronics Progress, 2022, 59(18): 1810005
- Laser & Optoelectronics Progress
- Vol. 59, Issue 18, 1810005 (2022)
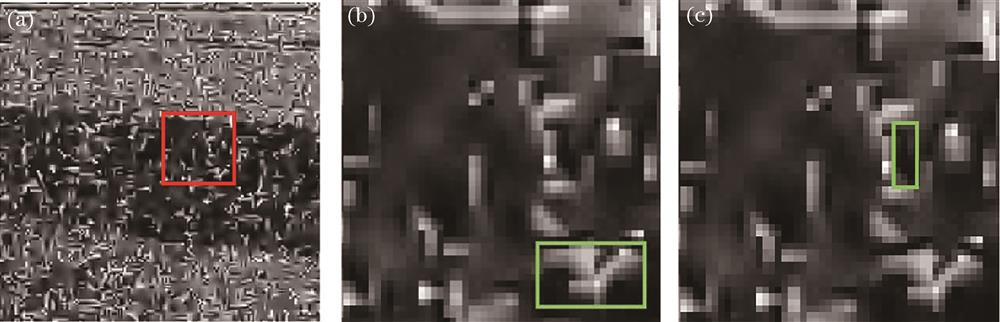
Fig. 1. Noise example in γ nuclear radiation scene. (a) Noise map; (b) bright patch noise; (c) dark patch noise
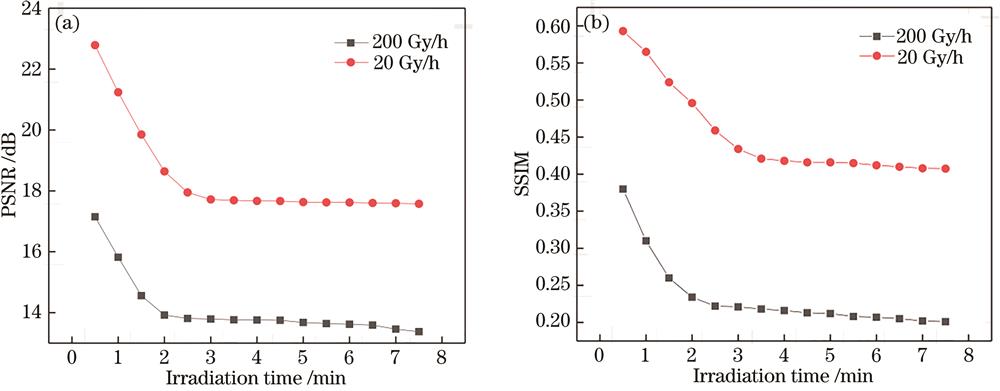
Fig. 2. Variation of image quality in γ radiation scene with increase of irradiation time. (a) Variation of PSNR; (b) variation of SSIM
Fig. 3. Detection results of bright patch noise in different γ radiation scene images. (a) Noise map in scene 1; (b) detection results of bright patch noise in [Fig.3(a)]; (c) binarization of [Fig.3(b)]; (d) noise map in scene 2; (e) detection results of bright patch noise in [Fig.3(d)]; (f) binarization of [Fig.3(e)]
Fig. 4. Detection results of dark patch noise in different γ radiation scene images. (a) Scene 1 pixel flip; (b) detection results of dark patch noise in [Fig.4(a)]; (c) binarization of [Fig.4(b)]; (d) scene 2 pixel flip; (e) detection results of dark patch noise in [Fig.4(d)]; (f) binarization of [Fig.4(e)]
Fig. 5. Time series correlation method for transient noise removal
Fig. 6. Denoising effect of different number of near frame images with different irradiation time. (a) PNSR value after denoising; (b) SSIM value after denoising
Fig. 7. Results of denoising and enhancement in different γ radiation scene images. (a) Noise map in scene 1; (b) denoising results of [Fig.7(a)]; (c) enhancement results of [Fig.7(b)]; (d) noise map in scene 2; (e) denoising result of [Fig.7(d)]; (f) enhancement result of [Fig.7(e)]
Fig. 8. Quality of noiseless image changes with average number of frames increase. (a) Variation of PSNR value; (b) variation of SSIM value
Fig. 9. Comparison of denoising results in 200 Gy/h γ radiation scene images. (a) Noise map; (b) median; (c) wavelet; (d) anisotropy;(e) PDE; (f) BM3D; (g) NLM; (h) guide; (i) TV; (j) proposed algorithm
Fig. 10. Comparison of denoising results in 20 Gy/h γ radiation scene images. (a) Noise map; (b) median; (c) wavelet; (d) anisotropy;(e) PDE; (f) BM3D; (g) NLM; (h) guide; (i) TV; (j) proposed algorithm
| |||||||||||||||||||||||||||||||||||||||||||||||||
Table 1. PSNR of denoising results in γ radiation scene images with
|
Table 2. Quantitative comparison of denoising results
|
Table 3. Quantitative comparison of denoising results in different size images

Set citation alerts for the article
Please enter your email address
© Copyright 2018-2021 | Chinese Laser Press. All Rights Reserved 沪ICP备15018463号-20