Zengle Cao, Fengrui Hu, Chunfeng Zhang, Shining Zhu, Min Xiao, Xiaoyong Wang, "Optical studies of semiconductor perovskite nanocrystals for classical optoelectronic applications and quantum information technologies: a review," Adv. Photon. 2, 054001 (2020)

Search by keywords or author
- Advanced Photonics
- Vol. 2, Issue 5, 054001 (2020)

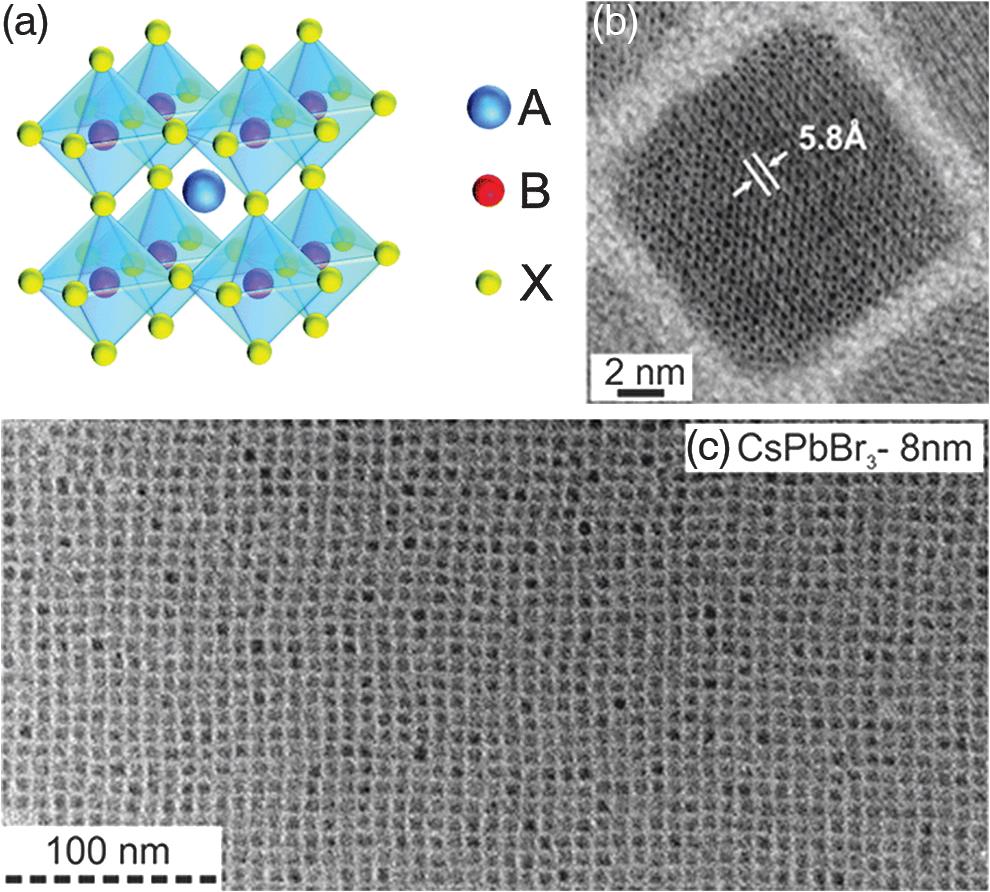
Fig. 1. (a) Schematic of the perovskite structure, where A is an organic or alkali-metal cation, B is a bivalent cation, and X is a monovalent anion. (b), (c) Typical TEM images of perovskite NCs. (a) Reproduced with permission from Ref. 3, courtesy of the Royal Society of Chemistry. (b), (c) Reproduced with permission from Ref. 5, courtesy of the American Chemical Society (ACS).

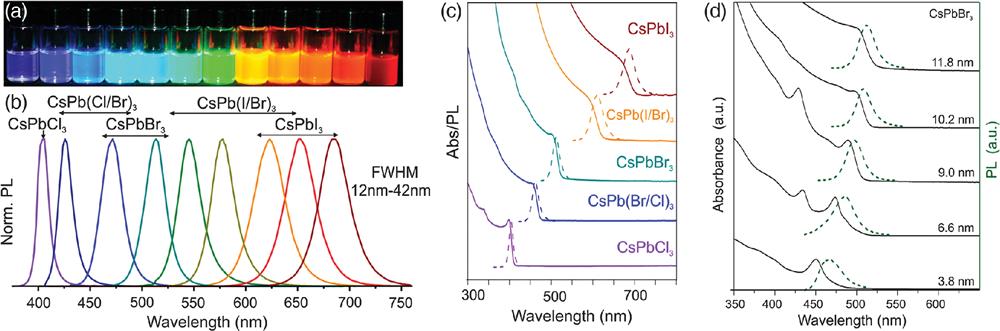
Fig. 2. (a) Optical images of solution NCs excited by a UV lamp and (b) the corresponding PL spectra. (c) Absorption and PL spectra of NCs with different halide compositions. (d) Absorption and PL spectra of NCs with different sizes. Reproduced with permission from Ref. 5, courtesy of ACS.

Fig. 3. (a) Schematic for the photoexcited carrier dynamics in perovskite NCs. (b) Typical TA spectra of NCs measured at different time delays between the pump and probe laser pulses. Reproduced with permission from Ref. 82, courtesy of ACS.

Fig. 4. (a) PL spectra measured as a function of the pump fluence for a solid film of NCs and (b) the corresponding threshold behavior for the ASE-band PL intensity. (c) Spectral tunability of the ASE band by means of compositional modulation. (d) Comparison between the mechanisms of biexciton gain and trion gain in neutral (left) and singly charged (right) colloidal NCs. (a)–(c) Reproduced with permission from Ref. 48, courtesy of Macmillan Publishers Limited. (d) Reproduced with permission from Ref. 105, courtesy of ACS.

Fig. 5. (a) Schematic for the buildup process of superfluorescence. (b) High-angle annular dark-field scanning TEM image of a single superlattice composed of NCs. Inset: A magnified view for part of the superlattice showing individual NCs. (c) PL spectra measured for NCs contained in a superlattice and a normal film, respectively. The high- and low-energy bands are assigned to uncoupled and coupled NCs, respectively. (d) Second-order autocorrelation functions measured for high- (upper graph) and low-energy (lower graph) bands, respectively. Inset: An example of superbunching from a single superlattice of NCs. (e) PL spectra measured for NCs in a superlattice microcavity showing enhanced superfluorescence. Inset: Simulated field distribution of the whispering gallery mode in this microcavity. (f) PL intensities of the cavity mode measured as a function of the laser pumping intensity. Inset: Lorentz fitting of the cavity mode with a quality factor of . (a)–(d) Reproduced with permission from Ref. 113, courtesy of Springer Nature Limited. (e), (f) Reproduced with permission from Ref. 114.

Fig. 6. Second-order autocorrelation functions measured for a single NC under both (a) continuous-wave and (b) pulsed laser excitations. (c) PL intensity time trace and the corresponding distribution histograms recorded for a single NC. (d) PL intensity time trace measured for a single NC with suppressed fluorescence blinking. (e) Time-dependent PL spectral image measured for a single NC with suppressed spectral diffusion. (a)–(c) Reproduced with permission from Ref. 123, courtesy of ACS. (d), (e) Reproduced with permission from Ref. 124, courtesy of ACS.

Fig. 7. (a) PL spectrum measured for a single NC with three emission peaks. (b) Schematic for the energy-level structures of band-edge excitons in metal-halide perovskite NCs, under the influences of both electron–hole exchange interaction and the Rashba effect. (c) One-, two-, and three-peaked PL spectra measured for three different NCs at zero magnetic field (upper panels), and their corresponding four-peaked PL spectra measured at the magnetic fields of 7, 4.4, and 7 T (lower panels), respectively, all revealing the lowest-energy singlet dark-exciton peak. (a) Reproduced with permission from Ref. 127, courtesy of ACS. (b) Reproduced with permission from Ref. 132, courtesy of Macmillan Publishers Limited. (c) Reproduced with permission from Ref. 128, courtesy of Springer Nature Limited.

Fig. 8. (a) Schematic for the PCFS measurement of a single NC with an energy separation of between the two fine-structured exciton states of and . For a short interphoton arrival time of and with the variation of the path-length difference , PCFS measures the envelope of the interferogram squared, which is modulated at a frequency of with a decaying amplitude of . (b) For a specific single NC with , an exciton dephasing time of can be fitted from the PCFS data, corresponding to a PL linewidth of estimated from the Fourier-transformed spectral correlation (inset). (c) Schematic for the quantum interference measurement of a single NC, excited by two trains of picosecond laser pulses with the coarse and fine time delays of and , respectively. (d) PL intensity measured at for a single NC as a function of , showing an oscillating behavior due to quantum interference between the two exciton wave functions (inset). The oscillating amplitudes of PL intensities obtained at different values could be exponentially fitted to yield an exciton dephasing time of 11.12 ps. (a), (b) Reproduced with permission from Ref. 153, courtesy of the American Association for the Advancement of Science. (c), (d) Reproduced with permission from Ref. 154, courtesy of ACS.

Fig. 9. Confocal scanning PL images of single NCs excited at (a) 405 nm and (b) 800 nm, respectively. (c) PL intensity profiles drawn across the solid lines in (a) and (b), and fitted with the Gaussian distributions, respectively. (d) PL intensities of a single NC plotted as a function of the square of the excitation laser power density, showing the PL saturation effect. Reproduced with permission from Ref. 165, courtesy of AIP Publishing.

Set citation alerts for the article
Please enter your email address