
De-Zhi Kong, Chao Sun, Ming-Yang Li. Weighted subspace detection method based on modal attenuation law in shallow water [J]. Acta Physica Sinica, 2020, 69(16): 164301-1
- Acta Physica Sinica
- Vol. 69, Issue 16, 164301-1 (2020)
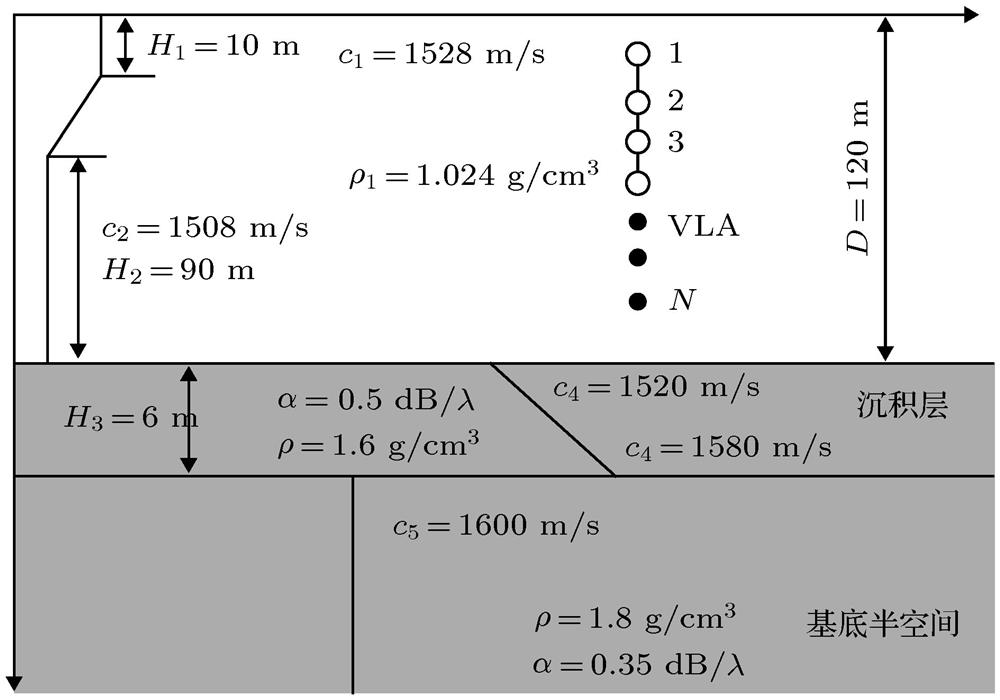
Fig. 1. The shallow water waveguide and its environmental parameters.
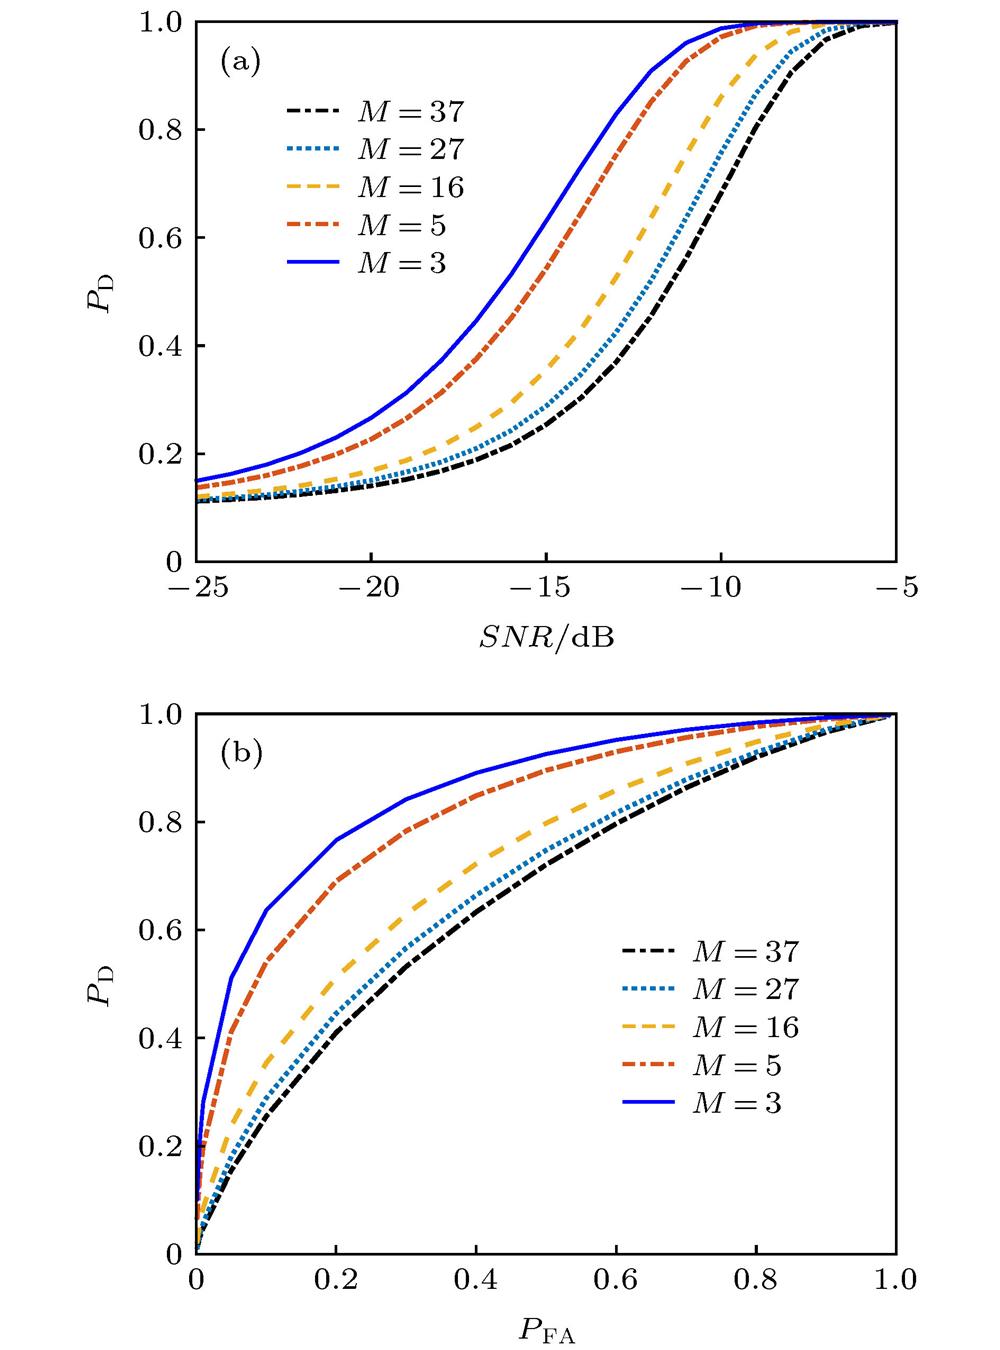
Fig. 2. Detection performance curves of the MSD under various numbers of normal modes: (a) Probabilities of detection versus SNR s,
 ; (b) probabilities of detection versus probabilities of false alarm,
 .
.
; (b) probabilities of detection versus probabilities of false alarm,
. Fig. 3. The processing gains of the MSD versus the numbers of normal modes.
Fig. 4. The processing gains of MSSD versus the orders of normal modes.
Fig. 5. Detection performance curves of the MSD, WMSSD and OWMSSD with f = 100 Hz: (a) Probabilities of detection versus SNR ,
 ; (b) probabilities of detection versus probabilities of false alarm,
 .
.
; (b) probabilities of detection versus probabilities of false alarm,
. Fig. 6. Detection performance curves of the MSD, WMSSD and OWMSSD with f = 300 Hz: (a) Probabilities of detection versus SNR ,
 ; (b) probabilities of detection versus probabilities of false alarm,
 .
.
; (b) probabilities of detection versus probabilities of false alarm,
. Fig. 7. The processing gains of the MSD, WMSSD and OWMSSD versus acoustic source locations with f = 300 Hz: (a) MSD; (b) WMSSD; (c) OWMSSD.
Fig. 8. The modal depth functions and their turning-depths with f = 300 Hz: (a) Each modal depth function in the waveguide; (b) the turning-depth of each modal depth function.
Fig. 9. The weighting coefficients and the processing gains of the MSSD with f = 300 Hz and source range of 15 km: (a) Source depth of 10 m; (b) source depth of 80 m.
Fig. 10. The critical depths versus ranges under various frequencies.
Fig. 11. The weighting coefficients and the processing gains of the MSSD with f = 300 Hz, source depth of 10 m and source range of 25 km.
Fig. 12. Constant sound velocity profile (SVP) and positive gradient SVP.
Fig. 13. The turning-depth of each modal depth function with f = 300 Hz.
Fig. 14. Each modal depth function in the two kinds of waveguides with f = 300 Hz: (a) Constant SVP; (b) positive gradient SVP.
Fig. 15. The processing gains of the WMSSD versus acoustic source locations with f = 300 Hz: (a) Constant SVP; (b) positive gradient SVP.


Set citation alerts for the article
Please enter your email address

© Copyright 2018-2021 | Chinese Laser Press. All Rights Reserved 沪ICP备15018463号-20