
K. A. Tanaka, K. M. Spohr, D. L. Balabanski, S. Balascuta, L. Capponi, M. O. Cernaianu, M. Cuciuc, A. Cucoanes, I. Dancus, A. Dhal, B. Diaconescu, D. Doria, P. Ghenuche, D. G. Ghita, S. Kisyov, V. Nastasa, J. F. Ong, F. Rotaru, D. Sangwan, P.-A. S?derstr?m, D. Stutman, G. Suliman, O. Tesileanu, L. Tudor, N. Tsoneva, C. A. Ur, D. Ursescu, N. V. Zamfir. Current status and highlights of the ELI-NP research program[J]. Matter and Radiation at Extremes, 2020, 5(2): 24402
- Matter and Radiation at Extremes
- Vol. 5, Issue 2, 24402 (2020)
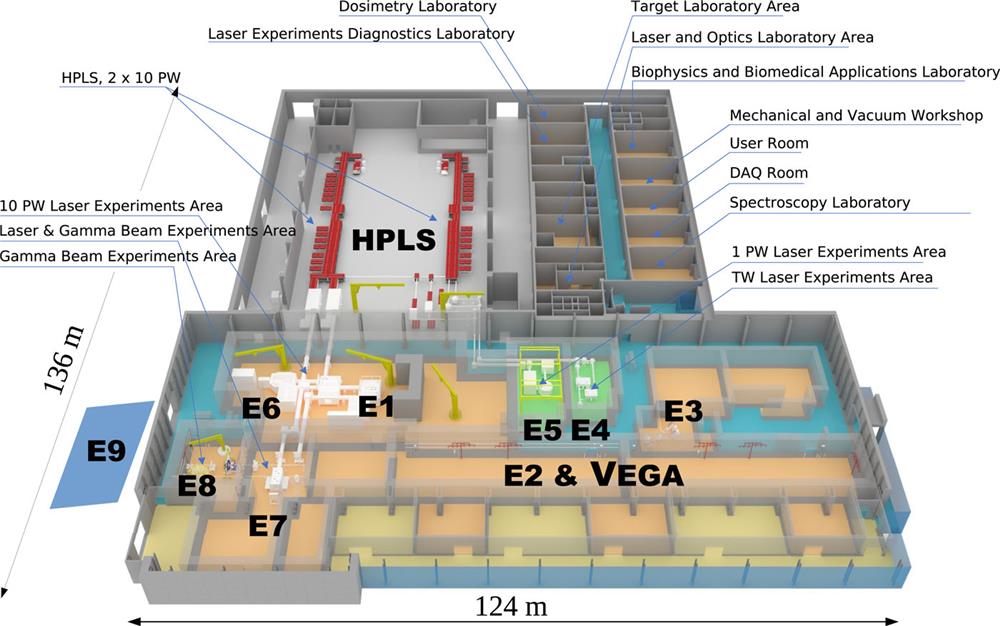
Fig. 1. Schematic overview of the HPLS and the VEGA system and associated target areas at ELI-NP. The two laser arms are depicted in red. The target areas E1, E4, E5, E6, and E7 show the 3D CAD designs of the target chambers currently under construction. The positions of the target areas E3, E8, and E9 associated with the VEGA system are indicated. The E9 area sits in the newly installed annex sketched by the blue footprint adjacent to the left side of the main building. The target area E2 will be facilitated for VEGA system-related experiments in the future.
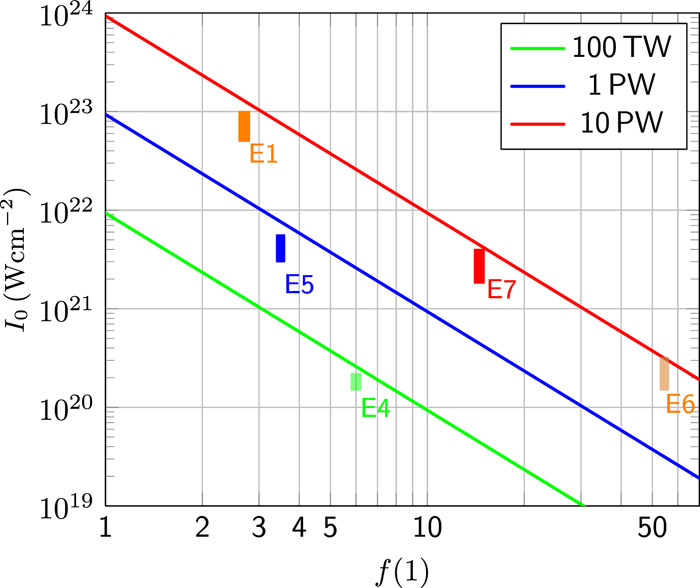
Fig. 2. Nominal peak intensity ranges I 0 as functions of the f number of the focusing mirrors installed at the target areas E1, E4, E5, E6, and E7 associated with the HPLS beams at ELI-NP. The solid lines describe the ideal case at the diffraction limit for which I 0 is at its maximum value.
Fig. 3. Regimes of laser-driven ion acceleration with Coulomb explosion (CE), target normal sheath acceleration (TNSA), and radiation-pressure-dominated acceleration (RPDA). The gray line indicates the opaque/transparent border and the dashed line the target thickness ℓ T for which the proton energy at a given I 0 will be maximal. The regimes overlap in certain parameter regions. Intensity conditions, as indicated by the green arrow, should be reachable with the ELI-NP 10 PW HPLS, employing self-supporting targets as thin as 10 nm. The regimes as depicted in this figure follow published work by Daido et al. 18
Fig. 4. Energy spectra of protons (black), C6+ (green), and γ radiation (red) emitted in the direction of pulse propagation according to a PIC2D-based Epoch code28 including QED effects. A circularly polarized laser beam of intensity 1023 W cm−2 and a fully ionized CH2 target with ℓ T = 800 nm were assumed.
Fig. 9. Proposed setup of the diagnostic detectors for a typical commissioning experiment at E1, showing the envelope of the Thomson parabola (TP) in blue close to the left target wall, as well as the gamma spectrometer (GS) and the e −–e + spectrometer (e −–e +S), which are placed facing the interaction point in the primary target in the vicinity of the middle of the chamber. The laser pulse envelope is shown in light red, with the focusing f /2.7 parabolic mirror on the lower left. The green (tube-)line indicates the light path associated with the optical plasma probing arrangement. The yellow circles on top of the gamma and e −–e + spectrometers indicate the connecting points for the optical fibers to be used for the readout.
Fig. 10. A 3D CAD view of the ELIADE array with the HPGe detectors shown in gray. The supporting frame is shown in blue. The voids in the frame can be equipped with LaBr3(Ce) detectors for selected experimental campaigns. The pipe for the incoming beam is shown in pink. Courtesy of A. Imreh.
Fig. 11. A 3D CAD view of the ELIGANT-GN array. The lanthanide bromide detectors are mounted in the inner frame (green). They cover the bottom half of the full sphere angles and are placed inside the outer frame (yellow) supporting the neutron detectors. These detectors cover the upper half of the sphere and are depicted in gray (the small red circles show the junctions with the coupled PMTs). The beam pipe emerging from the lower left of the figure is shown in pink. Courtesy of A. Imreh.
Fig. 12. Low-energy electric dipole (E 1) strength (a) and magnetic dipole (M 1) strength (b) distributions for 206Pb. Different counterparts of the transition matrix elements related to (a) PDR, GDR, and multiphonon contributions to the total E 1 strength and (b) single-phonon and multiphonon contributions to the total M 1 strength, obtained from the three-phonon EDF + QPM approach, are shown.
Fig. 13. The Gamma Polari-Calorimeter (GPC) design relies on the beam interacting with a converter material to produce electron–positron pairs. Both of these particles are measured using a combination of a magnetic field and pixelated position-sensitive detectors. The black crosses on the sensitive elements represent the input data that feed the reconstruction algorithm.
Fig. 14. Simulation of the azimuthal angle of the pair creation plane for a 1 GeV γ beam. Modulation of the cross-section in the linearly polarized case (blue triangles) is clearly emphasized compared with the non-polarized beam case (red circles).
Fig. 15. Projections of cosmic muon trajectories in the detector volume. Experimental data is shown in (a)–(c) and simulated muon trajectories are displayed in (d)–(f) showing the projections of the trajectories on the xy , xz , and yz planes.
|
Table 1. Laser system parameters shared by the three HPLS beamlines at ELI-NP.
|
Table 2. Operational parameters of the three HPLS beamlines at ELI-NP.
| |||||||||||||||
Table 3. Summary of the three HPLS at ELI-NP, including associated target station areas, summaries of the physical motivations, and selected detector equipment, as well as specific laser parameters. The detector equipment listed will be explicitly described in Table V (active detectors) and VI (passive detectors) in Sec. III .
|
Table 4. Summary of the target areas associated with the VEGA system, motivation, selected detector equipment, and specific parameters. The detector equipment shown will be explicitly described in Table VII in Sec. IV . The use of area E2 is yet to be decided.
|
Table 5. Summary of active detectors in the target areas E1, E5, and E6 to be used in inaugural commissioning experiments facilitating the HPLS.
|
Table 6. Summary of the passive and optical detector systems in the target areas E1, E5, and E6 to be used in inaugural commissioning experiments facilitating the HPLS.
|
Table 7. Summary of detector systems related to the VEGA system in the areas E3, E7, E8, and E9 at ELI-NP.

Set citation alerts for the article
Please enter your email address
© Copyright 2018-2021 | Chinese Laser Press. All Rights Reserved 沪ICP备15018463号-20