
Funing Dong, Qing Yang, Mandan Luo, Ning Chen, Wei Liao. Current Sensor Based on Magnetostriction and Fiber Bragg Grating[J]. Acta Optica Sinica, 2022, 42(8): 0806001
- Acta Optica Sinica
- Vol. 42, Issue 8, 0806001 (2022)
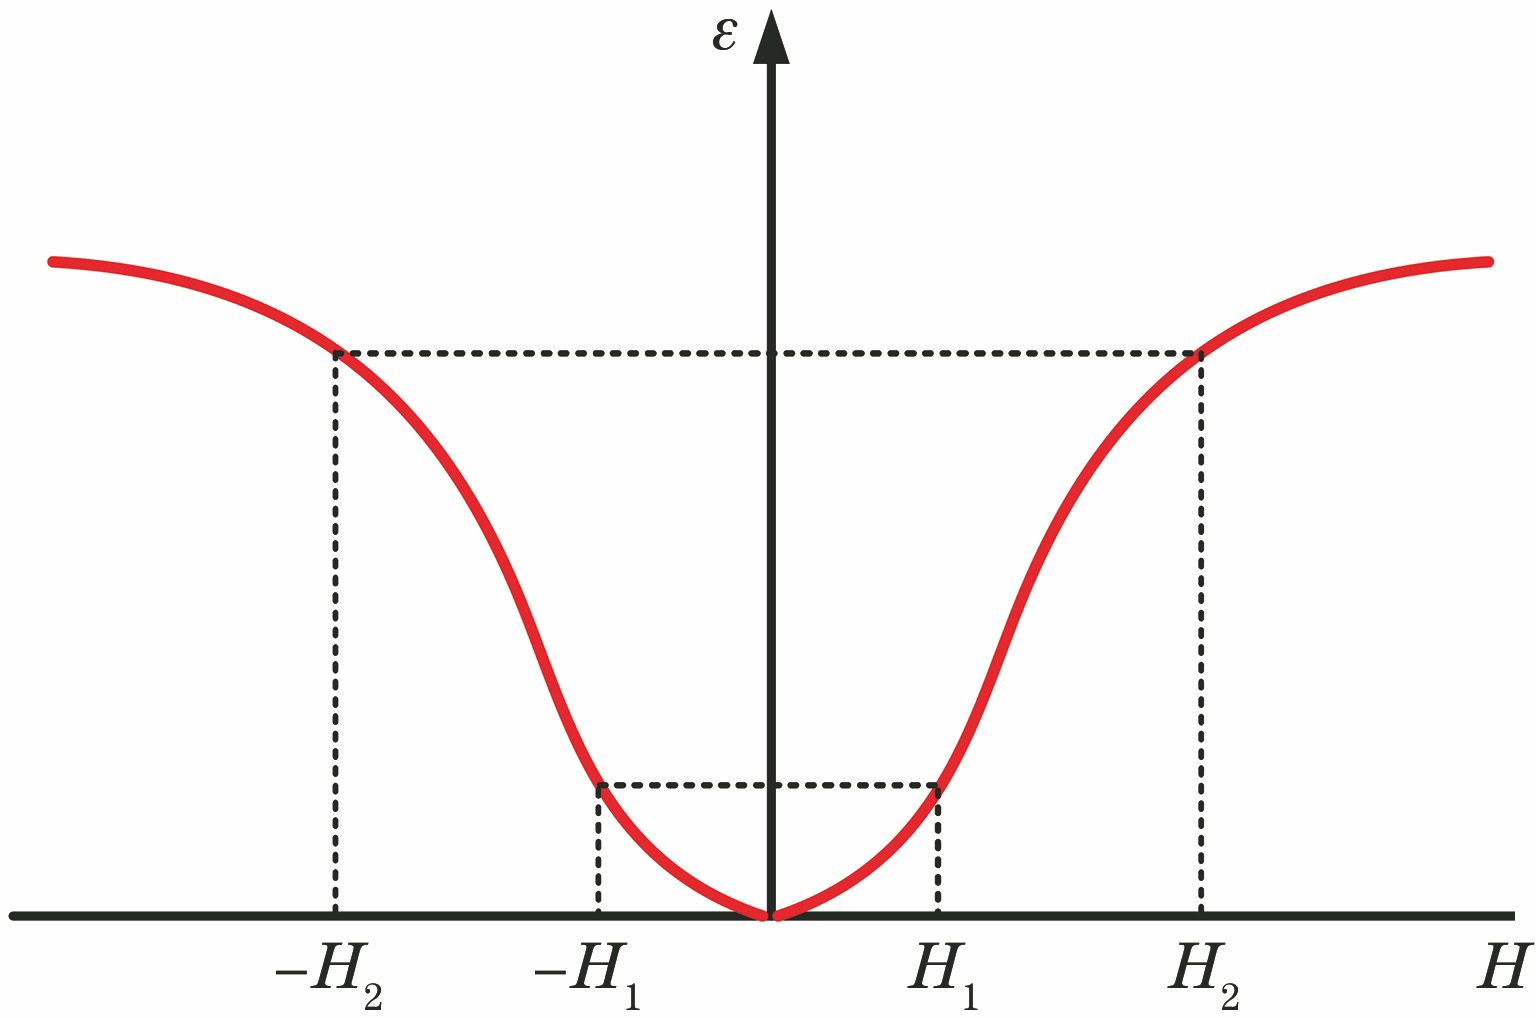
Fig. 1. Magnetostrictive strain-magnetic field curve of GMM
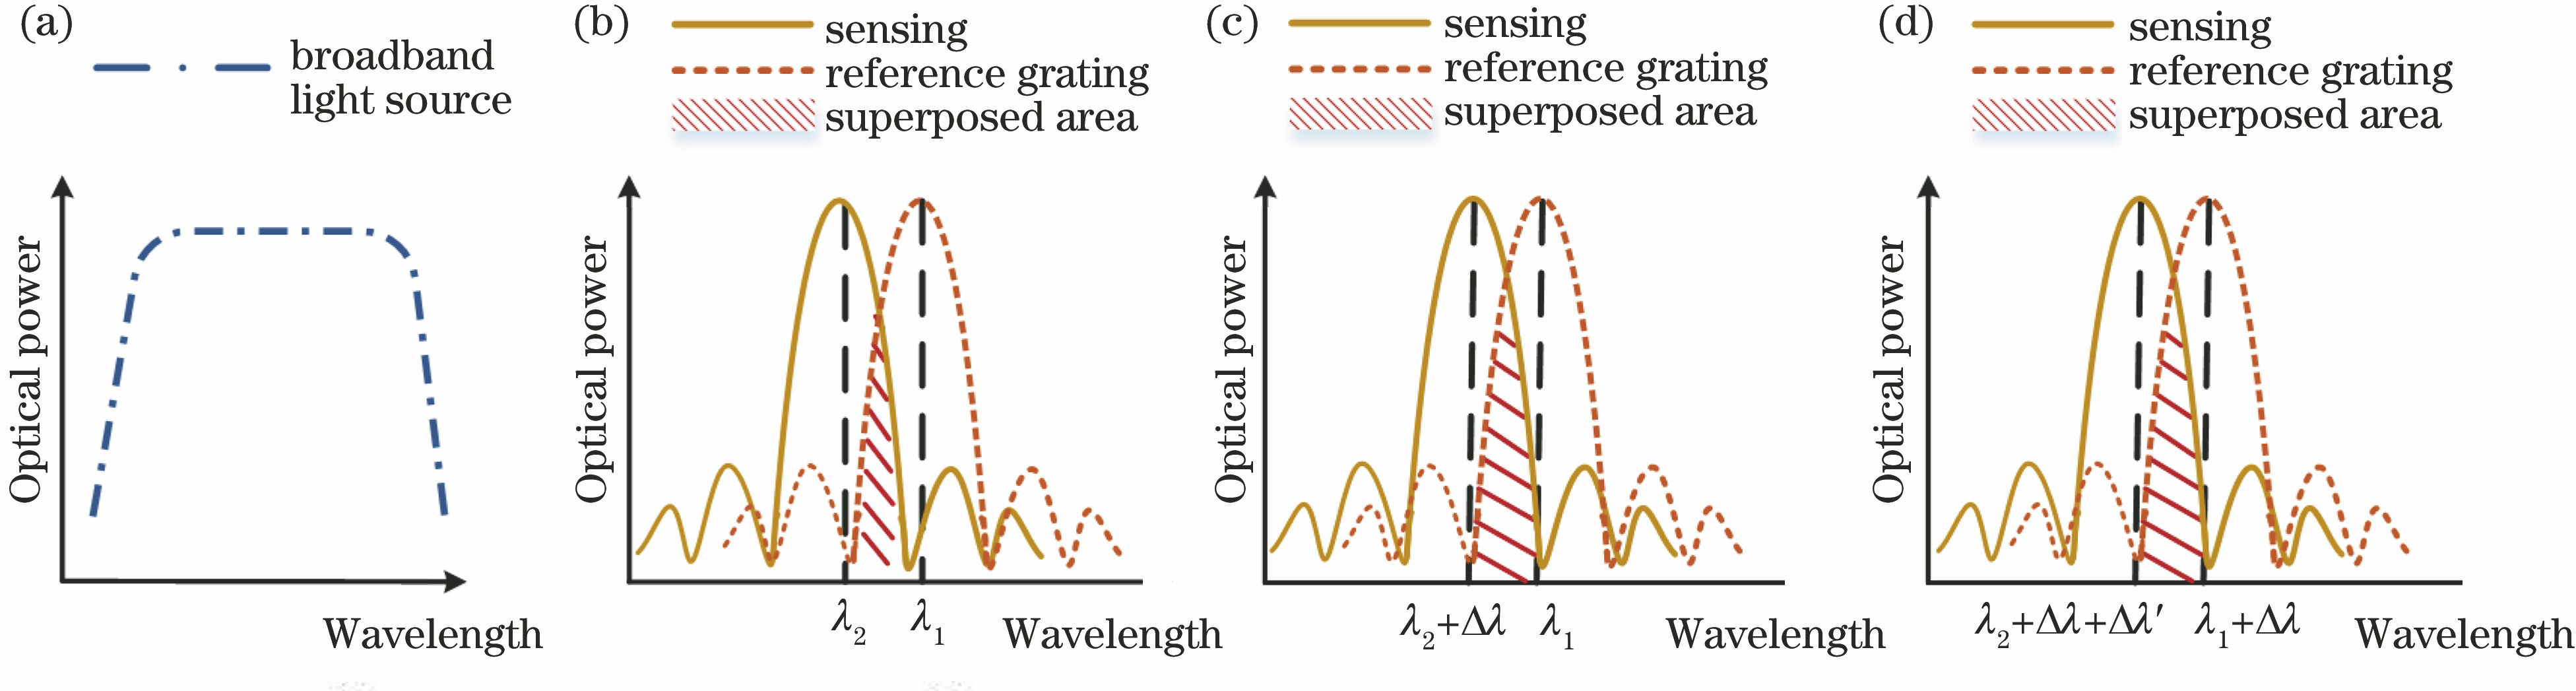
Fig. 2. Basic principle of double grating-intensity demodulation method. (a) Spectrum of broadband light source; (b) reflection spectrum of sensing FBG and reference FBG; (c) change of reflection spectrum under stress; (d) change of reflection spectrum under combined action of stress and temperature
Fig. 3. Schematic of sensor test system
Fig. 4. Magnetic flux density distribution of system
Fig. 5. Axial flux density distribution curves of sensing GMM and reference GMM
Fig. 6. Relationship among magnetic field distribution of sensing GMM and reference GMM and position of reference GMM. (a) Curve of p values changing with reference GMM position; (b) curves of m values changing with reference GMM position
Fig. 7. Relationship among p, m and length of reserved expansion space
Fig. 8. Relationship between magnetic field distribution of sensing GMM and cross-sectional side length of magnetic ring
Fig. 9. Relationship among p, m, and opening length above magnetic ring
Fig. 10. DC characteristic curves of sensor
Fig. 11. Input/output relation of sensor without bias current
Fig. 12. Amplitude frequency characteristic curve of sensor
Fig. 13. Sinusoidal input-output curves at different frequencies. (a) 50.0 Hz; (b) 2.0 kHz; (c) 4.0 kHz; (d) 6.5 kHz; (e) 8.0 kHz; (f) 10.0 kHz
Fig. 14. Layout diagram of sensor temperature characteristic test system
Fig. 15. Temperature characteristic test curves of sensor. (a) Gain; (b) phase difference
|
Table 1. Output amplitude of sensor at different frequencies
|
Table 2. Sensor output amplitude and phase difference at different temperatures

Set citation alerts for the article
Please enter your email address
© Copyright 2018-2021 | Chinese Laser Press. All Rights Reserved 沪ICP备15018463号-20