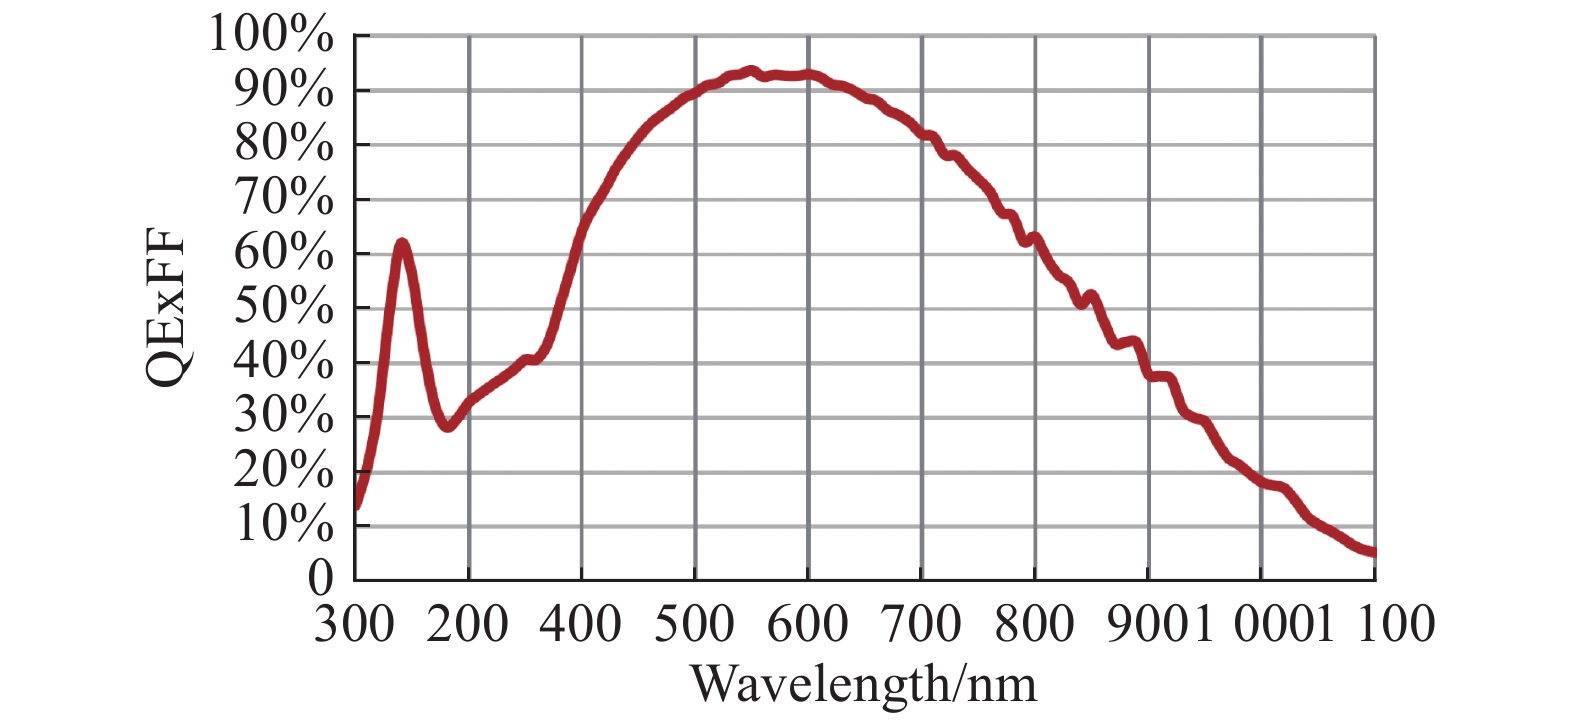
Fig. 1. Spectrum response curve of GSENSE2020BSI detector
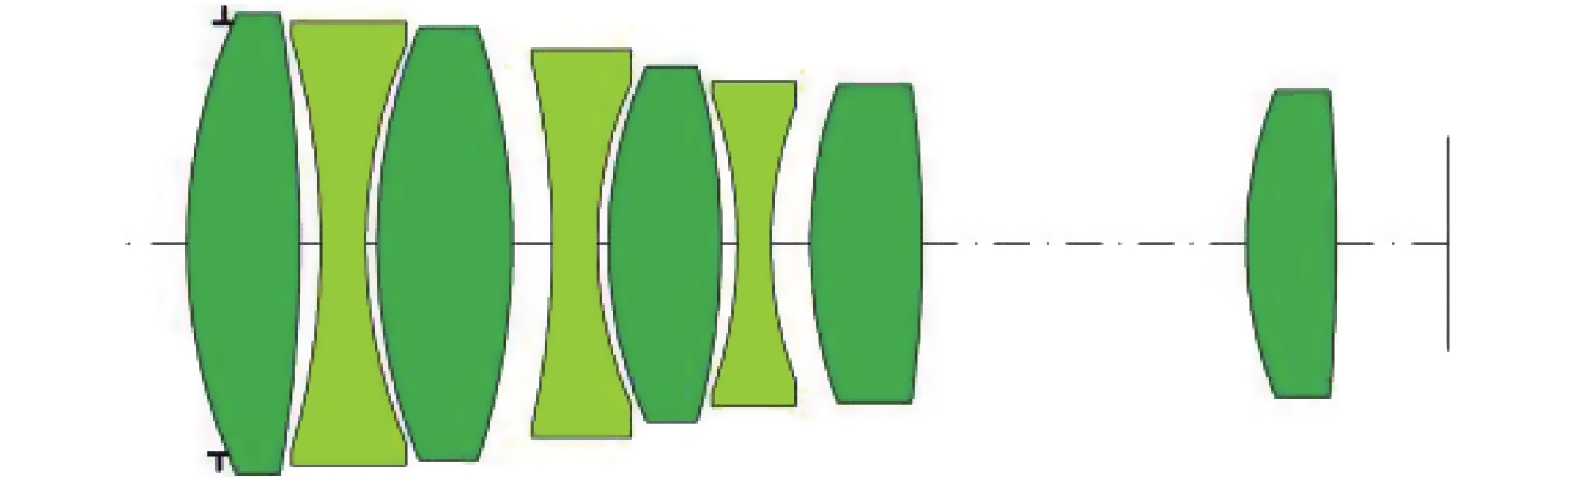
Fig. 2. Schematic diagram of optical system
Fig. 3. Flow chart of optimization design
Fig. 4. Light path diagram of optical system
Fig. 5. Design curves of astigmatism and distortion
Fig. 6. Design curves of lateral chromatic aberration
Fig. 7. Design result of MTF
Fig. 8. Encircled energy curves
Fig. 9. Relative value of centroid drifting under change of star temperature
Fig. 10. Relative value of centroid drifting under change of temperature (Unit: μm)
Fig. 11. Measurement results of MTF on axis
Fig. 12. Measurement of optical spot
Parameters | Values | Focal length/mm | 95±0.5 | FOV/(°) | ≥8×8 | Pupil(F#)
| 2.4 | Waveband range/nm | 450−1 000 | Energy concentration | ≥85% in 3 ×3 pixels | Centroid excursion/(″) | ≤1.5 | Distortion | ≤0.05% | Temperature/℃ | 0-40 |
|
Table 1. Parameters of optical system design
光学系统设计指标
Wavelength/nm | Temperature/K | 2 600 | 3 100 | 4 300 | 5 000 | 5 500 | 6 000 | 6 800 | 7 600 | 9 800 | 475 | 10 | 18 | 37 | 44 | 47 | 48 | 50 | 52 | 55 | 525 | 32 | 51 | 87 | 96 | 99 | 99 | 99 | 99 | 99 | 575 | 51 | 71 | 97 | 99 | 98 | 95 | 91 | 88 | 82 | 625 | 70 | 86 | 99 | 94 | 90 | 85 | 78 | 73 | 66 | 675 | 87 | 96 | 95 | 86 | 80 | 73 | 65 | 60 | 51 | 725 | 98 | 99 | 86 | 74 | 67 | 60 | 53 | 47 | 38 | 775 | 99 | 92 | 72 | 60 | 53 | 47 | 40 | 35 | 28 | 825 | 92 | 80 | 56 | 45 | 39 | 34 | 29 | 25 | 19 | 875 | 83 | 68 | 44 | 34 | 29 | 25 | 21 | 18 | 13 | 925 | 68 | 53 | 32 | 24 | 20 | 17 | 14 | 12 | 9 | 975 | 31 | 21 | 12 | 9 | 7 | 6 | 5 | 4 | 3 |
|
Table 2. Distribution values of wavelength weight with different temperature stars
不同色温恒星的波长权重分配值
Parameters | Results | Focal length/mm | 94.932 1 | FOV/(°) | 8×8 | Pupil(F#)
| 2.4 | Waveband range/mm | 450−1 000 | Energy concentration | ≥85% in 3×3 pixels | Centroid excursion/(″) | ≤1.0 | Distortion | ≤0.003 25% | Temperature/℃ | 0−40 |
|
Table 3. Results of optical system design
光学系统设计结果
Relative field | 0 W | 0.3 W | 0.5 W | 0.7 W | 0.85 W | 1.0 W | Relative centroid drifting/μm | 2 600 K | 0 | −0.038 4 | −0.075 6 | −0.152 9 | 0.089 6 | 0.268 4 | 3 100 K | 0 | −0.042 5 | −0.068 7 | 0.317 5 | 0.207 8 | −0.236 4 | 4 300 K | 0 | −0.034 6 | −0.045 2 | 0.249 3 | 0.187 6 | −0.197 8 | 5 000 K | 0 | −0.015 8 | −0.027 2 | 0.132 1 | 0.096 2 | 0.105 8 | 5 500 K | 0 | 0 | 0 | 0 | 0 | 0 | 6 000 K | 0 | 0.008 4 | 0.009 6 | −0.156 2 | −0.126 5 | −0.205 9 | 6 800 K | 0 | 0.012 7 | 0.015 3 | −0.184 4 | −0.152 3 | 0.079 8 | 7 600 K | 0 | 0.015 2 | 0.018 5 | −0.232 1 | −0.205 9 | 0.183 9 | 9 800 K | 0 | 0.027 8 | 0.048 7 | −0.355 4 | −0.248 1 | 0.213 1 |
|
Table 4. Relative value of centroid drifting under change of star temperature (Unit: μm)
恒星色温改变质心变化相对值(单位:μm)
Temperature /℃ | Relative field | 0 W | 0.3 W | 0.5 W | 0.7 W | 0.85 W | 1.0 W | 0 | 0 | −0.201 3 | −0.286 4 | −0.389 6 | −0.254 1 | −0.756 2 | 5 | 0 | −0.089 5 | −0.152 6 | −0.256 8 | −0.215 2 | −0.198 3 | 10 | 0 | −0.065 8 | −0.095 6 | −0.201 7 | −0.195 8 | −0.232 5 | 15 | 0 | −0.023 1 | −0.012 6 | 0.058 9 | 0.037 5 | 0.025 9 | 20 | 0 | 0 | 0 | 0 | 0 | 0 | 25 | 0 | 0.033 5 | 0.015 2 | 0.085 6 | 0.075 3 | 0.085 2 | 30 | 0 | 0.074 6 | 0.112 3 | 0.193 3 | 0.172 5 | 0.264 6 | 35 | 0 | 0.113 5 | 0.203 7 | 0.356 4 | 0.250 9 | 0.325 4 | 40 | 0 | 0.250 4 | 0.321 8 | 0.450 5 | 0.279 5 | 0.563 7 |
|
Table 5. Relative value of centroid drifting under change of temperature (Unit: μm)
温度改变质心变化相对值(单位:μm)
Temperature /℃ | 0 | 5 | 10 | 15 | 20 | 25 | 30 | 35 | 40 | Focal length /mm | 94.929 4 | 94.930 2 | 94.930 8 | 94.931 5 | 94.932 1 | 94.932 7 | 94.933 3 | 94.933 9 | 94.934 5 | Difference /μm | −2.7 | −1.9 | −1.3 | −0.6 | 0 | 0.6 | 1.2 | 1.8 | 2.4 |
|
Table 6. Focal lengths and relative change under different temperatures
不同温度下系统焦距及相对变化值