
Zhiwei Chen, Chengyuan Ma, Bo Chen, Caiwang Tan, Xiaoguo Song. Microstructure and Properties of Medium-Thick Stainless Steel by Laser-MIG Hybrid Welding[J]. Laser & Optoelectronics Progress, 2020, 57(23): 231405
- Laser & Optoelectronics Progress
- Vol. 57, Issue 23, 231405 (2020)
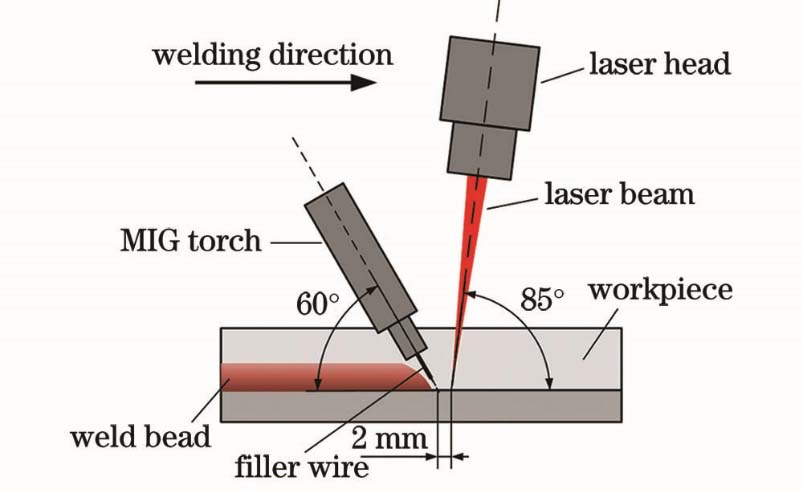
Fig. 1. Schematic diagram of the welding process
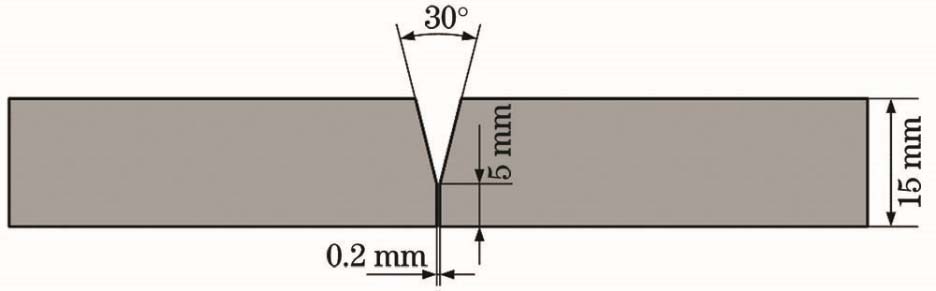
Fig. 2. Schematic diagram of bevel size
Fig. 3. Schematic of the tensile specimen. (a) Selection location of tensile sample; (b) size of tensile sample
Fig. 4. Cross-section morphology of welds with different combinations. (a) Sample A1; (b) sample A2; (c) sample A3; (d) sample A4
Fig. 5. Microstructure of 316L austenitic stainless steel
Fig. 6. Filling weld structure. (a) (d) HAZ of A1 and A3; (b) (e) weld center of A1 and A3; (c) (f) zones of A and B
Fig. 7. Underlying weld structure. (a) (d) HAZ of A1 and A2; (b) (e) weld center of A1 and A2; (c) (f) zones of C and D
Fig. 8. Schematic diagram of fracture locations of tensile test specimens
Fig. 9. Stress-strain curves at different positions of each sample joint. (a) Filling weld; (b) underlying weld
Fig. 10. Fracture morphology of tensile samples. (a) (b) Upper layer fracture of A1 and its micro area; (c) (d) upper layer fracture of A3 and its micro area; (e) (f) lower layer fracture of A1 and its micro area; (g) (h) lower layer fracture of A2 and its micro area
Fig. 11. Microhardness of different parts of the weld joint. (a) Filling layer; (b) underlying layer
|
Table 1. Chemical composition (mass fraction) of 316L austenitic stainless steel and ER316L stainless steel filler wire unit: %
|
Table 2. Welding process parameters
| |||||||||||||||||||||||||||||||||||||||
Table 3. Tensile strength and elongation of different samples

Set citation alerts for the article
Please enter your email address
© Copyright 2018-2021 | Chinese Laser Press. All Rights Reserved 沪ICP备15018463号-20