
Jie Zhao, Jirimutu Qiao, Xuetong Ding, Xiaomin Liang. fNIRS Signal Motion Correction Algorithm Based on Mathematical Morphology and Median Filter[J]. Acta Optica Sinica, 2020, 40(22): 2230002
- Acta Optica Sinica
- Vol. 40, Issue 22, 2230002 (2020)
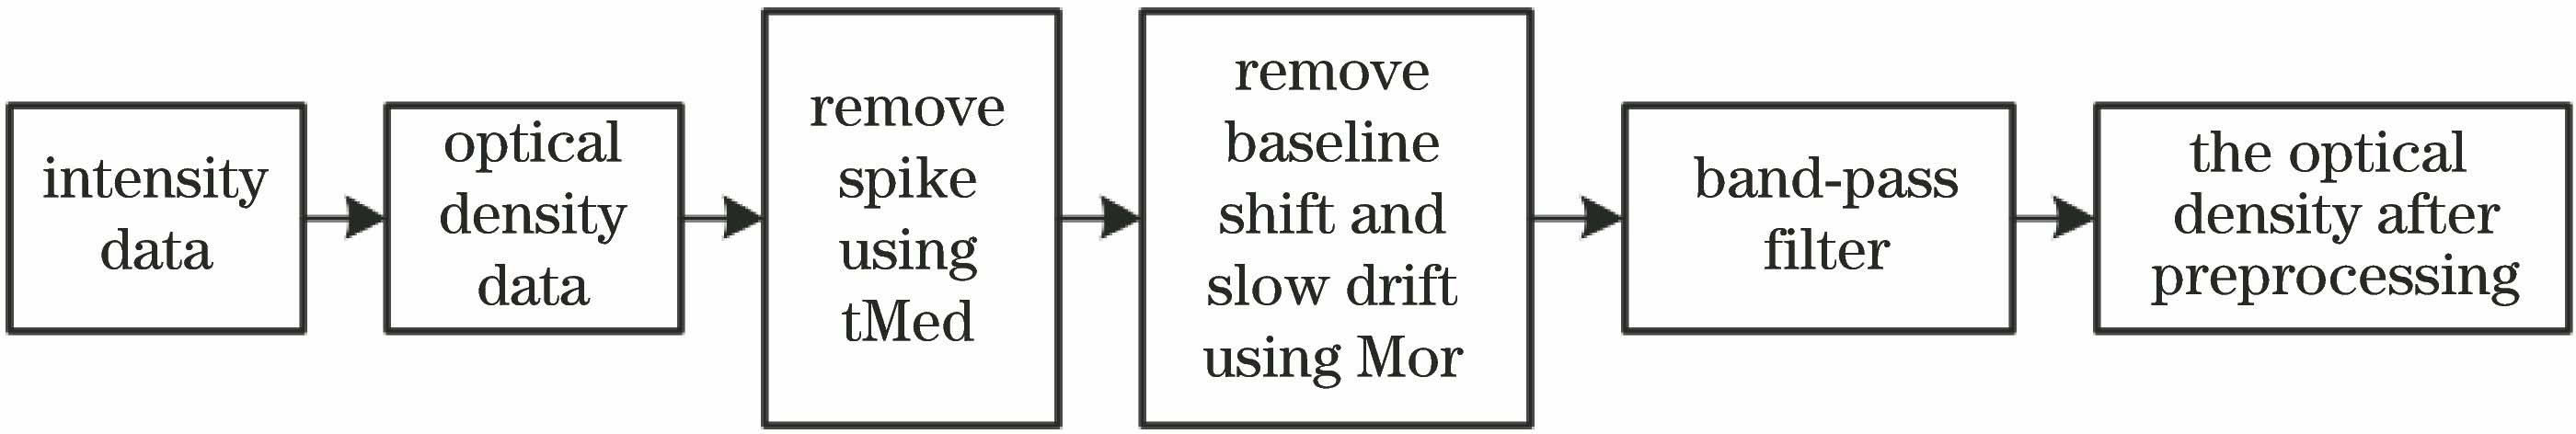
Fig. 1. fNIRS signal preprocessing flowchart using tMedMor algorithm
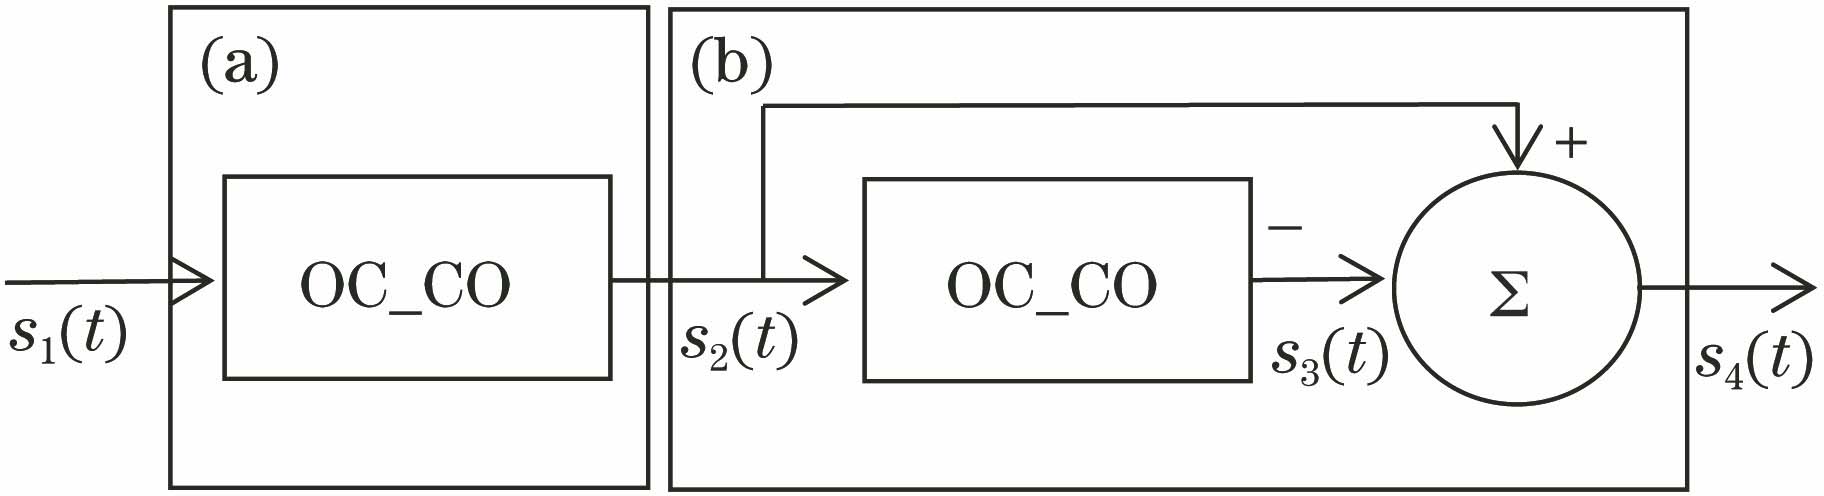
Fig. 2. Flow chart of Mor algorithm
Fig. 3. Unilateral power spectral density of noiseless OD signal
Fig. 4. Unilateral power spectral density of noiseless OD signal
Fig. 5. Waveform of simulation data after using tMedMor algorithm, the data in the figure was selected from OD signal with a wavelength of 830 nm in a certain channel. (a) OD signals contaminated by motion artifacts; (b) OD signal corrected by tMed algorithm; (c) OD signal corrected by Mor algorithm; (d) comparing OD signal corrected by tMedMor algorithm with OD signal without motion artifacts
Fig. 6. Evaluation indices calculated after correcting motion artifacts of simulated block-average HbO signal with different algorithms. (a) EMS; (b) RSN; (c) R2; (d) Ep
Fig. 7. Waveform of real data after using tMedMor algorithm, the data in the figure was selected from OD signal with a wavelength of 830 nm in a certain channel. (a) OD signals contaminated by motion artifacts; (b) OD signal corrected by tMed method; (c) OD signal corrected by Mor algorithm; (d) comparing OD signal corrected by tMedMor algorithm with OD signal without motion artifacts
Fig. 8. Evaluation indices calculated after correcting motion artifacts of true block-average HbO signal with different algorithms. (a) EMS; (b) RSN; (c) R2; (d) Ep
|
Table 1. EMS, RSN, R2 and Ep of simulated block-average HbO signal after processing by different algorithms
|
Table 2. EMS, RSN, R2 and Ep of real block-average HbO signal after processing by different algorithms

Set citation alerts for the article
Please enter your email address
© Copyright 2018-2021 | Chinese Laser Press. All Rights Reserved 沪ICP备15018463号-20