• Journal of Semiconductors
  • Vol. 44, Issue 3, 032602 (2023)
Ruiyang Yin1、3, Linlin Li1、2, Lili Wang1、2, and Zheng Lou1、2、*
Author Affiliations
  • 1State Key Laboratory for Superlattices and Microstructures, Institute of Semiconductors, Chinese Academy of Sciences, Beijing 100083, China
  • 2Center of Materials Science and Optoelectronic Engineering, University of Chinese Academy of Sciences, Beijing 100083, China
  • 3Department of Materials Science and Engineering, College of Engineering, Peking University, Beijing 100871, China
  • show less
    DOI: 10.1088/1674-4926/44/3/032602 Cite this Article
    Ruiyang Yin, Linlin Li, Lili Wang, Zheng Lou. Self-healing Au/PVDF-HFP composite ionic gel for flexible underwater pressure sensor[J]. Journal of Semiconductors, 2023, 44(3): 032602 Copy Citation Text show less
    (Color online) Design and fabrication of transparent, mechanically robust, and ultrastable ionic gels enabled by ionic interactions. (a) Schematic diagram of ionic gel design. (b) Potential applications of ionic gel in different fields. (c) Self-healing and sensing mechanism of ionic gel materials. (d) Schematic diagram of ionic gel synthesis process.
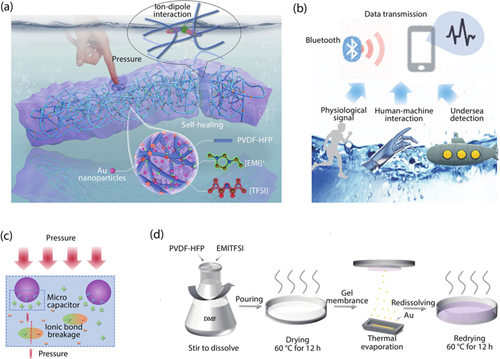
    Fig. 1. (Color online) Design and fabrication of transparent, mechanically robust, and ultrastable ionic gels enabled by ionic interactions. (a) Schematic diagram of ionic gel design. (b) Potential applications of ionic gel in different fields. (c) Self-healing and sensing mechanism of ionic gel materials. (d) Schematic diagram of ionic gel synthesis process.
    (Color online) Morphology and characterization of ionic gel. (a) Schematic diagram of ionic gel SEM. (b) Element analysis of gel section slices, respectively showing the uniform distribution of S, N, and Au. (c) UV absorption spectra of ionic gels before and after doping Au nanoparticles. After doping with Au nanoparticles, an obvious peak appears in the band around 530 nm. (d) Comparison of infrared absorption spectra before and after doping Au nanoparticles. There was no change in the covalent bond before and after the Au nanoparticles were recombined. (e, f) Raman spectra before and after doping Au nanoparticles. The Raman spectra in the spectral range 720–780 cm–1 corresponding to EMIM+ vibrational bands. The Raman peak in the range of 720–780 cm–1 corresponding to TFSI– anion expansion–contraction mode. (g) Mechanical tensile properties and Young's modulus. The self-healing process of the physical image: (h) The picture above shows self-healing naturally at room temperature for 3 min, and (i) the picture below shows self-healing under water.
    Fig. 2. (Color online) Morphology and characterization of ionic gel. (a) Schematic diagram of ionic gel SEM. (b) Element analysis of gel section slices, respectively showing the uniform distribution of S, N, and Au. (c) UV absorption spectra of ionic gels before and after doping Au nanoparticles. After doping with Au nanoparticles, an obvious peak appears in the band around 530 nm. (d) Comparison of infrared absorption spectra before and after doping Au nanoparticles. There was no change in the covalent bond before and after the Au nanoparticles were recombined. (e, f) Raman spectra before and after doping Au nanoparticles. The Raman spectra in the spectral range 720–780 cm–1 corresponding to EMIM+ vibrational bands. The Raman peak in the range of 720–780 cm–1 corresponding to TFSI anion expansion–contraction mode. (g) Mechanical tensile properties and Young's modulus. The self-healing process of the physical image: (h) The picture above shows self-healing naturally at room temperature for 3 min, and (i) the picture below shows self-healing under water.
    (Color online) Pressure sensor performance. (a) Schematic diagram of the structure for capacitive pressure sensor device. (b) Principle model of pressure sensor. (c) Frequency sweep of capacitive pressure sensor under different pressures. (d) Sensitivity curve of capacitive pressure sensor. (e) Perception of slight pressure. (f, g) Response/recovery speed under 20 Pa and 2 kPa pressure. (h) Continuous testing of different pressures.
    Fig. 3. (Color online) Pressure sensor performance. (a) Schematic diagram of the structure for capacitive pressure sensor device. (b) Principle model of pressure sensor. (c) Frequency sweep of capacitive pressure sensor under different pressures. (d) Sensitivity curve of capacitive pressure sensor. (e) Perception of slight pressure. (f, g) Response/recovery speed under 20 Pa and 2 kPa pressure. (h) Continuous testing of different pressures.
    (Color online) Simple application in life. (a) Schematic diagram of the device used for underwater testing. (b) 2 kPa pressure perception under three different conditions (normal, underwater and after self-healing). (c) Finger bending perception. (d) Arm movement perception.
    Fig. 4. (Color online) Simple application in life. (a) Schematic diagram of the device used for underwater testing. (b) 2 kPa pressure perception under three different conditions (normal, underwater and after self-healing). (c) Finger bending perception. (d) Arm movement perception.
    (Color online) Practical underwater display. Perception of different water depths according to different water pressures. (a) Water depth measurement according to the proportional relationship between water pressure and water depth. (b) Continuous testing at the same water depth. Submarine diving and ascent process underwater (The sensor is attached to the palm of the robotic claw). (c) The sensor capacitance changes during the diving and ascent of the submarine. (d) The sensor capacitance changes when the submarine continuously dives/floats to a certain depth. Manipulator grabbing objects underwater (the sensor is attached to the head of submarine toy). (e) The capacitance of the pressure sensor changes when the mechanical gripper stays in different water depths. (f) The capacitance of the pressure sensor changes when the mechanical claw grabs an object underwater.
    Fig. 5. (Color online) Practical underwater display. Perception of different water depths according to different water pressures. (a) Water depth measurement according to the proportional relationship between water pressure and water depth. (b) Continuous testing at the same water depth. Submarine diving and ascent process underwater (The sensor is attached to the palm of the robotic claw). (c) The sensor capacitance changes during the diving and ascent of the submarine. (d) The sensor capacitance changes when the submarine continuously dives/floats to a certain depth. Manipulator grabbing objects underwater (the sensor is attached to the head of submarine toy). (e) The capacitance of the pressure sensor changes when the mechanical gripper stays in different water depths. (f) The capacitance of the pressure sensor changes when the mechanical claw grabs an object underwater.
    Ruiyang Yin, Linlin Li, Lili Wang, Zheng Lou. Self-healing Au/PVDF-HFP composite ionic gel for flexible underwater pressure sensor[J]. Journal of Semiconductors, 2023, 44(3): 032602
    Download Citation