• Acta Optica Sinica
  • Vol. 40, Issue 5, 0501003 (2020)
Huangrong Chen, Jingwei Zhang, Shengqiang Wang, Deyong Sun, and Zhongfeng Qiu*
Author Affiliations
  • School of Marine Sciences, Nanjing University of Information Science & Technology, Nanjing, Jiangsu 210044, China
  • show less
    DOI: 10.3788/AOS202040.0501003 Cite this Article Set citation alerts
    Huangrong Chen, Jingwei Zhang, Shengqiang Wang, Deyong Sun, Zhongfeng Qiu. Study on Diurnal Variation of Turbidity in the Yangtze Estuary and Adjacent Areas by Remote Sensing[J]. Acta Optica Sinica, 2020, 40(5): 0501003 Copy Citation Text show less
    Turbidity statistics obtained by buoy observing. (a) Reservoir; (b) Zhejiang coastal water
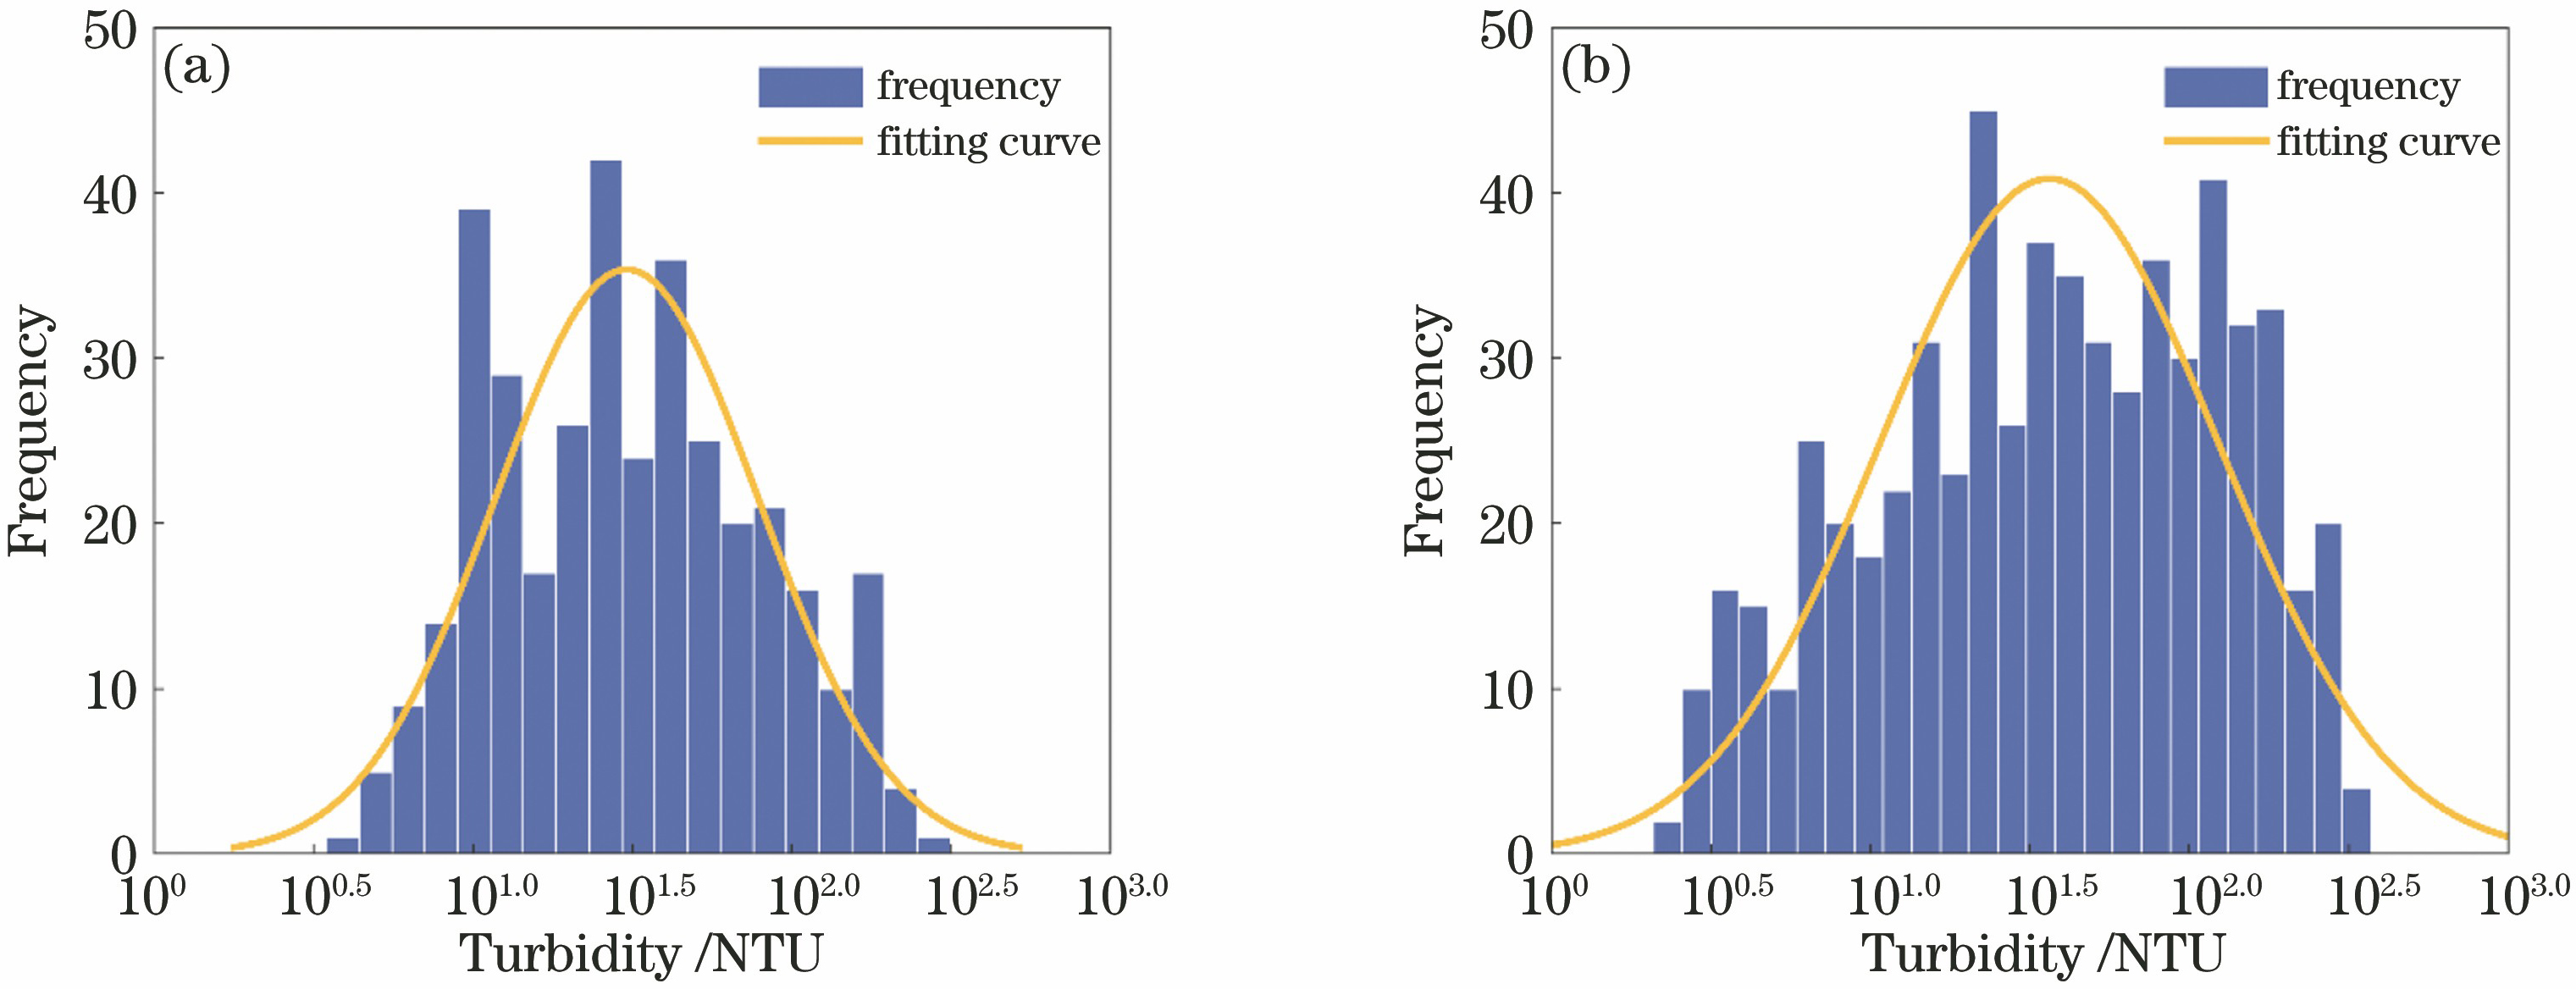
    Fig. 1. Turbidity statistics obtained by buoy observing. (a) Reservoir; (b) Zhejiang coastal water
    Rrc spectra and correlation coefficients. (a) Rrc spectra; (b) correlation coefficients
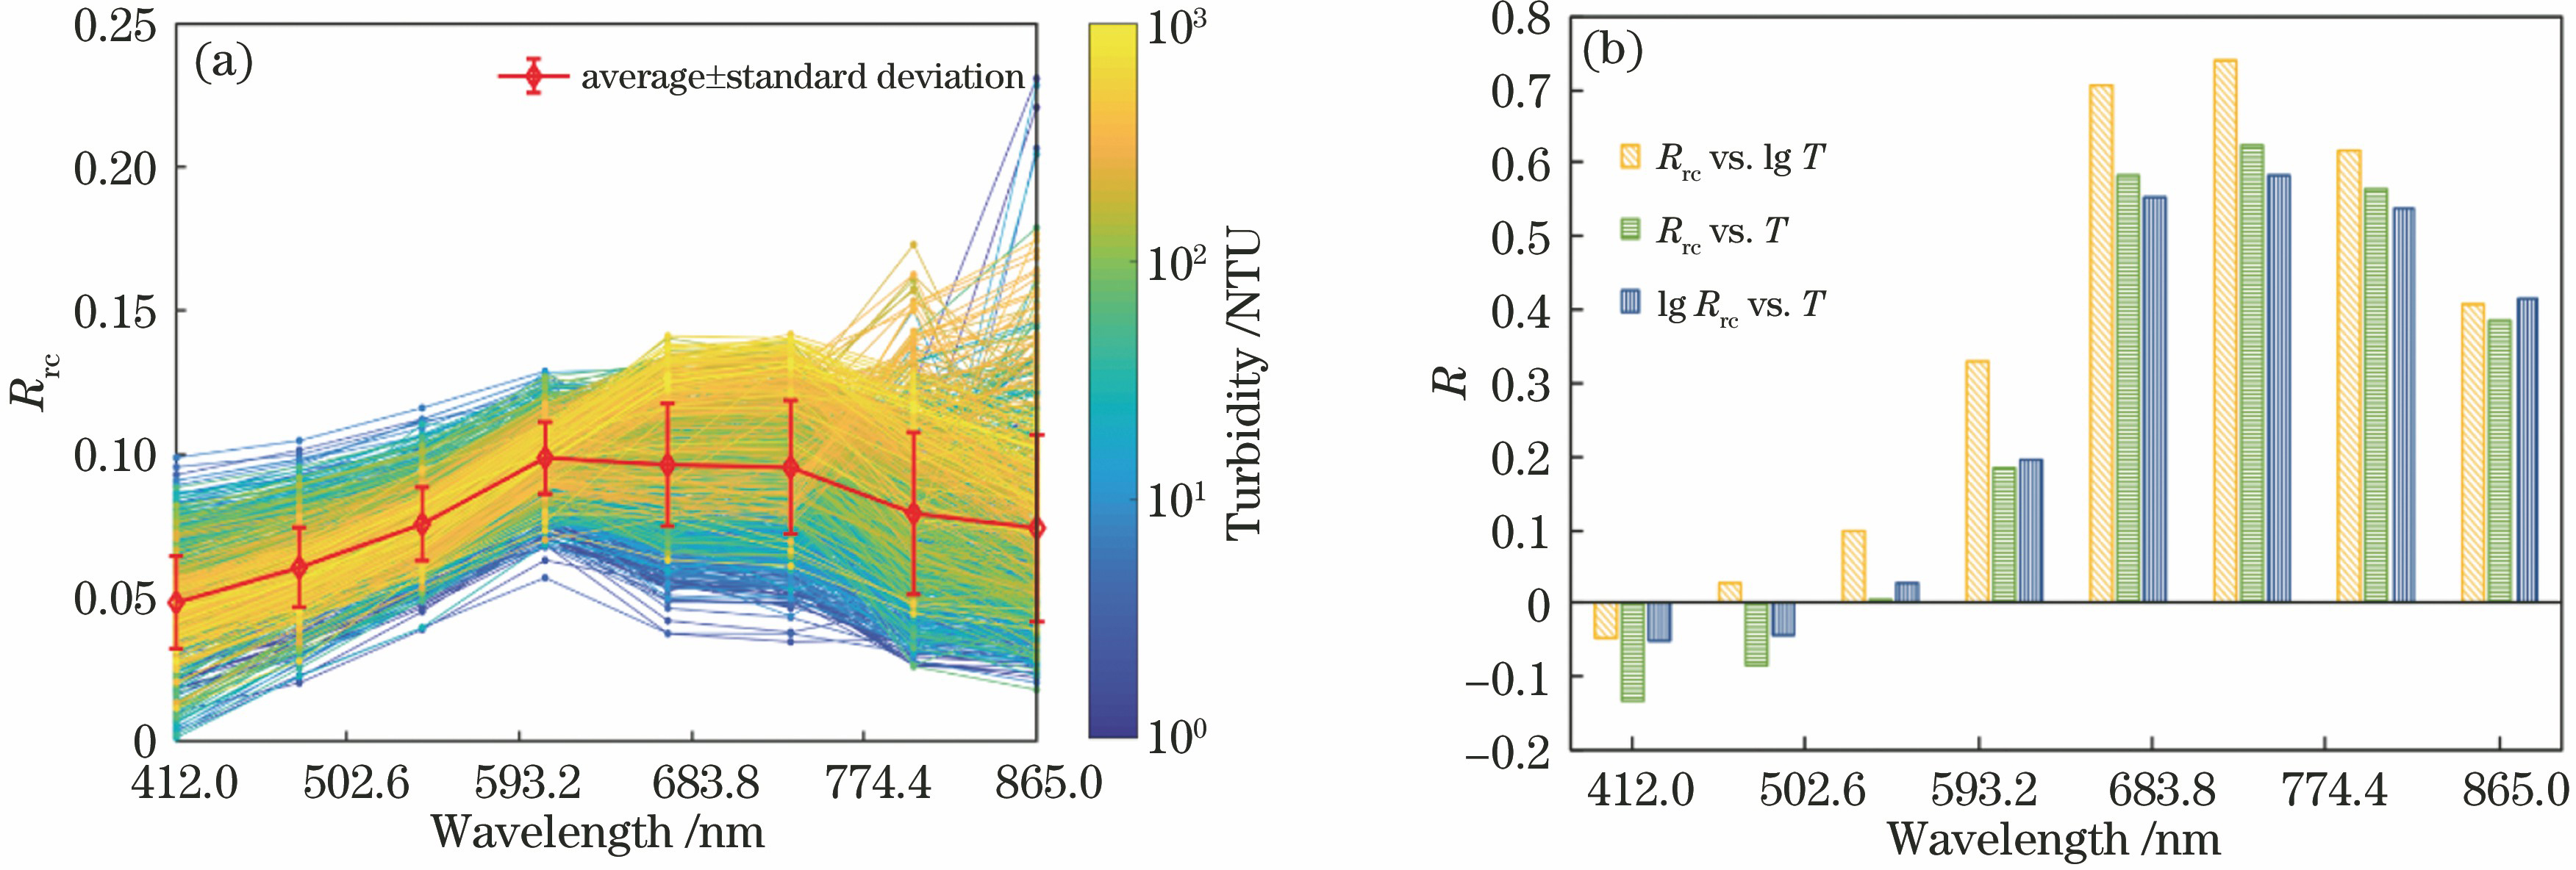
    Fig. 2. Rrc spectra and correlation coefficients. (a) Rrc spectra; (b) correlation coefficients
    Scatter plots of estimated turbidity and measured turbidity. (a)(b) Model based on combination 1; (c)(d) model based on combination 2
    Fig. 3. Scatter plots of estimated turbidity and measured turbidity. (a)(b) Model based on combination 1; (c)(d) model based on combination 2
    Hourly turbidity changes of the Yangtze estuary and adjacent sea areas, asterisk represents position of ‘Shitang’ tide gauge station. (a)--(h) Turbidity distributions at different times
    Fig. 4. Hourly turbidity changes of the Yangtze estuary and adjacent sea areas, asterisk represents position of ‘Shitang’ tide gauge station. (a)--(h) Turbidity distributions at different times
    Diurnal turbidity changes along longitude. (a) Transect I near Hangzhou bay; (b) transect II near Taizhou
    Fig. 5. Diurnal turbidity changes along longitude. (a) Transect I near Hangzhou bay; (b) transect II near Taizhou
    Hourly turbidity changes of reservoir and adjacent channel region. (a)--(h) Turbidity distributions at different times
    Fig. 6. Hourly turbidity changes of reservoir and adjacent channel region. (a)--(h) Turbidity distributions at different times
    Diurnal turbidity changes inside reservoir, vertical dashed line is boundary of reservoir. (a) Transect III; (b) transect IV
    Fig. 7. Diurnal turbidity changes inside reservoir, vertical dashed line is boundary of reservoir. (a) Transect III; (b) transect IV
    Monthly mean distributions of turbidity and turbid zone. (a)-(l) Turbidity distributions at different months
    Fig. 8. Monthly mean distributions of turbidity and turbid zone. (a)-(l) Turbidity distributions at different months
    Scatter plots of measured and estimated turbidity after adding random errors into Rrc. (a) 680 nm; (b) 490 nm
    Fig. 9. Scatter plots of measured and estimated turbidity after adding random errors into Rrc. (a) 680 nm; (b) 490 nm
    Hourly changes of tidal elevation and turbidity of “Shitang” tide gauge station
    Fig. 10. Hourly changes of tidal elevation and turbidity of “Shitang” tide gauge station
    No.Band combination formR
    1Rrc(B6)0.7408
    2Rrc(B6)-Rrc(B3)0.7977
    3Rrc(B4)/Rrc(B6)0.7964
    4Rrc(B6)-Rrc(B4)Rrc(B6)+Rrc(B4)0.7959
    5Rrc(B3)+Rrc(B6)Rrc(B3)/Rrc(B6)0.7926
    6Rrc(B6)-Rrc(B4)Rrc(B6)/Rrc(B4)0.7812
    7Rrc(B5)-Rrc(B3)Rrc(B6)/Rrc(B5)0.7932
    8Rrc(B4)-Rrc(B3)+Rrc(B7)Rrc(B6)/Rrc(B4)0.8152
    9Rrc(B6)+Rrc(B7)+Rrc(B4)Rrc(B3)/Rrc(B6)0.8280
    Note: Bj stands for the jth band.
    Table 1. Correlation comparison between different band combinations of Rrc and lg T[23]
    Huangrong Chen, Jingwei Zhang, Shengqiang Wang, Deyong Sun, Zhongfeng Qiu. Study on Diurnal Variation of Turbidity in the Yangtze Estuary and Adjacent Areas by Remote Sensing[J]. Acta Optica Sinica, 2020, 40(5): 0501003
    Download Citation