Author Affiliations
1School of Geography and Tourism, Qufu Normal University, Rizhao 276826, China2Rizhao Key Laboratory of Territory Spatial Planning and Ecological Construction, Rizhao 276826, China3Jinling College, Nanjing Normal University, Nanjing 210046, Chinashow less
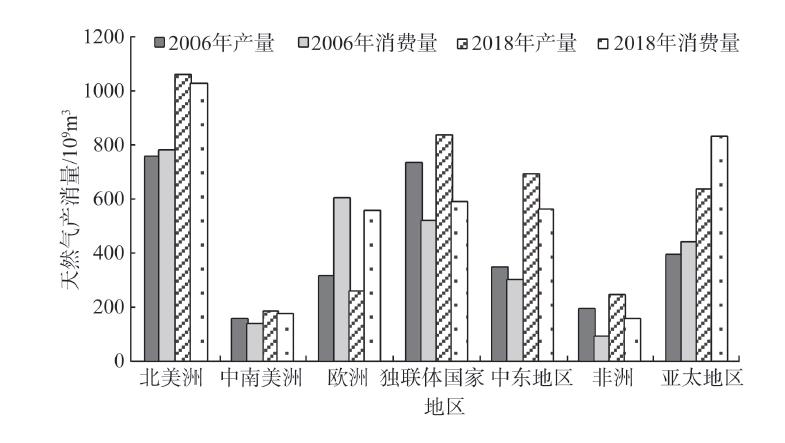
Fig. 1. World natural gas production and consumption statistics, 2006 and 2018
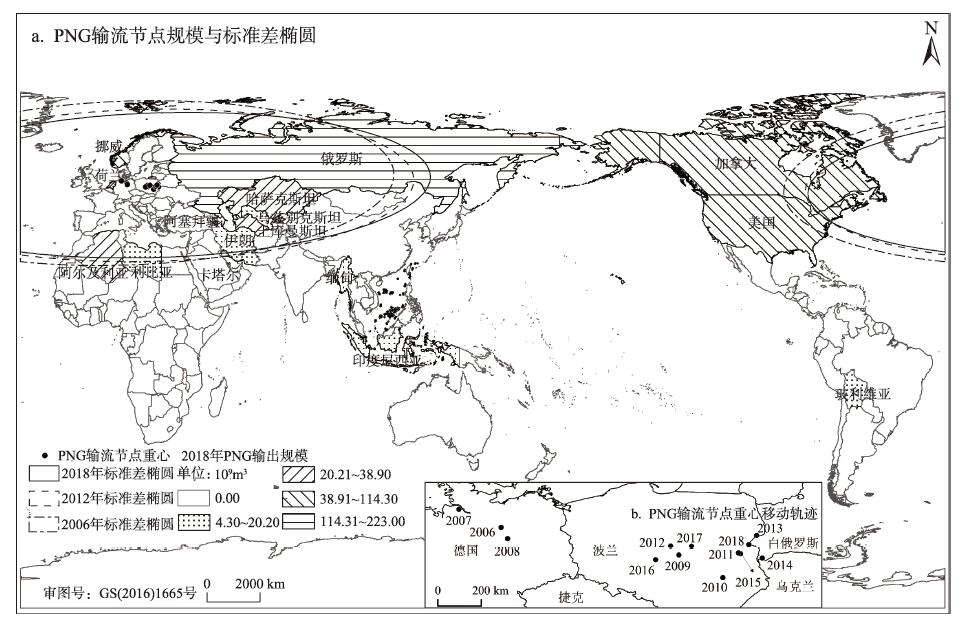
Fig. 2. Spatial pattern of pipeline natural gas (PNG) export nodes, 2006, 2012 and 2018
Fig. 3. Spatial pattern of liquefied natural gas (LNG) export nodes, 2006, 2012 and 2018
Fig. 4. Spatial pattern of pipeline natural gas (PNG) import nodes, 2006, 2012 and 2018
Fig. 5. Spatial pattern of liquefied natural gas (LNG) import nodes, 2006, 2012 and 2018
Fig. 6. Communication network of natural gas flow nodes, 2018
| 年份 | 管道天然气输流节点标准差椭圆 | | 液化天然气输流节点标准差椭圆 |
|---|
| 沿X轴标准差/km | 沿Y轴标准差/km | 扁率/km | 转角/° | 沿X轴标准差/km | 沿Y轴标准差/km | 扁率/km | 转角/° |
|---|
| 2006 | 10414.71 | 2761.99 | 7652.73 | 88.28 | | 8457.77 | 1661.08 | 6796.69 | 100.48 | | 2007 | 10555.81 | 2484.11 | 7652.73 | 89.29 | 8337.24 | 1720.05 | 6617.19 | 100.20 | | 2008 | 10353.60 | 2641.25 | 7712.35 | 89.57 | 8205.97 | 1859.39 | 6346.58 | 100.48 | | 2009 | 10114.44 | 2612.27 | 7502.17 | 89.66 | 8163.01 | 2343.06 | 5819.95 | 100.15 | | 2010 | 2713.20 | 10078.61 | 7365.41 | 90.17 | 7918.98 | 2577.70 | 5341.28 | 98.86 | | 2011 | 10406.45 | 2564.49 | 7365.41 | 89.14 | 7695.00 | 2558.90 | 5136.10 | 97.79 | | 2012 | 10375.99 | 2565.21 | 7810.78 | 88.94 | 7467.91 | 2548.18 | 4919.73 | 97.91 | | 2013 | 10425.11 | 2541.04 | 7810.78 | 88.38 | 7600.16 | 2632.06 | 4968.10 | 97.64 | | 2014 | 10305.73 | 2623.00 | 7682.73 | 88.87 | 7786.83 | 2683.17 | 5103.66 | 98.18 | | 2015 | 10415.64 | 2619.96 | 7795.68 | 88.83 | 7926.00 | 2707.20 | 5218.80 | 100.27 | | 2016 | 10502.13 | 2541.78 | 7960.35 | 88.77 | 8451.08 | 2764.10 | 5686.98 | 102.30 | | 2017 | 10671.18 | 2471.41 | 8199.77 | 88.43 | 9548.89 | 2742.43 | 6806.46 | 102.79 | | 2018 | 10654.50 | 2436.27 | 8218.23 | 88.41 | 10286.12 | 2966.04 | 7320.08 | 102.93 |
|
Table 1. Standard deviation ellipse (SDE) parameters of export nodes, 2006-2018
| 年份 | 管道天然气汇流节点标准差椭圆 | | 液化天然气汇流节点标准差椭圆 |
|---|
| 沿X轴标准差/km | 沿Y轴标准差/km | 扁率/km | 转角/° | 沿X轴标准差/km | 沿Y轴标准差/km | 扁率/km | 转角/° |
|---|
| 2006 | 7911.50 | 2117.23 | 5794.27 | 90.00 | | 11431.57 | 777.00 | 10654.57 | 92.25 | | 2007 | 8103.50 | 1940.67 | 6162.84 | 91.07 | 11938.70 | 789.73 | 11148.97 | 91.95 | | 2008 | 8022.61 | 1820.70 | 6201.91 | 92.05 | 10675.36 | 906.56 | 9768.80 | 91.06 | | 2009 | 8405.10 | 2068.47 | 6336.62 | 90.58 | 11141.72 | 1312.91 | 9828.82 | 91.33 | | 2010 | 8568.67 | 2222.12 | 6346.54 | 92.17 | 11141.34 | 1820.83 | 9320.51 | 89.98 | | 2011 | 8901.03 | 2305.38 | 6595.66 | 92.39 | 10631.85 | 2045.73 | 8586.12 | 89.94 | | 2012 | 8900.54 | 2342.60 | 6557.94 | 92.09 | 9972.259 | 2070.66 | 7901.60 | 87.23 | | 2013 | 8779.82 | 2240.61 | 6539.21 | 91.58 | 9913.99 | 2121.09 | 7792.90 | 84.87 | | 2014 | 8924.91 | 2428.43 | 6496.47 | 91.68 | 9931.07 | 2112.19 | 7818.88 | 84.45 | | 2015 | 8733.08 | 2365.05 | 6368.04 | 91.41 | 9715.28 | 2138.51 | 7576.77 | 84.89 | | 2016 | 8914.41 | 2316.50 | 6597.91 | 90.46 | 9163.36 | 2019.01 | 7144.35 | 85.49 | | 2017 | 8889.89 | 2263.25 | 6626.64 | 90.09 | 8720.93 | 1882.16 | 6838.77 | 85.84 | | 2018 | 9263.05 | 2232.01 | 7031.04 | 89.51 | 8433.98 | 1774.84 | 6659.13 | 86.33 |
|
Table 2. Standard deviation ellipse (SDE) parameters of import nodes, 2006-2018