
Yan-Qiang Guo, Li-Jing Wang, Yu Wang, Xin Fang, Tong Zhao, Xiao-Min Guo. Analysis and measurement of high-order photon correlations of light fields [J]. Acta Physica Sinica, 2020, 69(17): 174204-1
- Acta Physica Sinica
- Vol. 69, Issue 17, 174204-1 (2020)
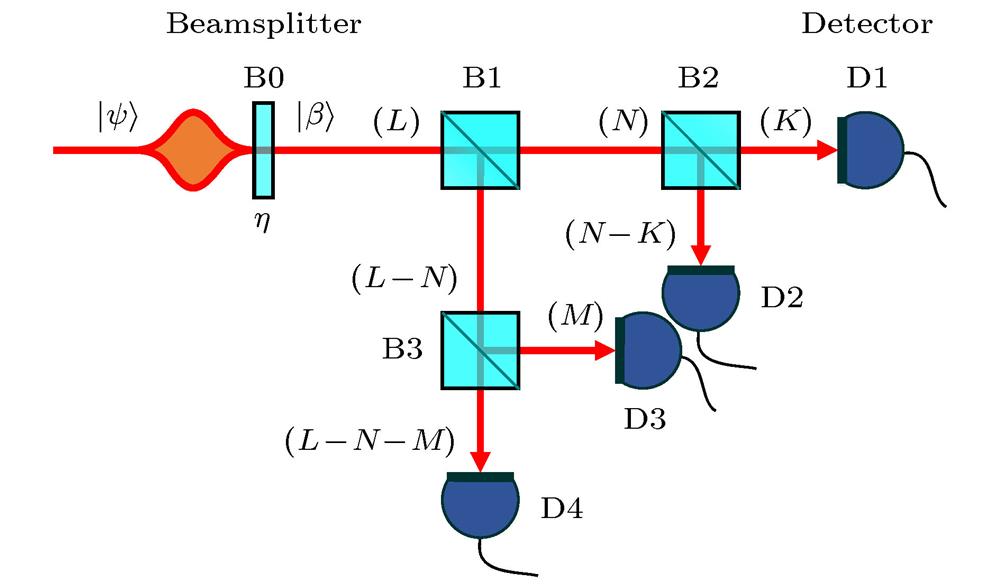
Fig. 1. Theoretical model of double HBT scheme. B0, B1, B2, B3: Beamsplitter; D1, D2, D3, D4: Detector. The letters in parentheses L , N, K , et al, denote the photon numbers of splitting light paths, respectively.
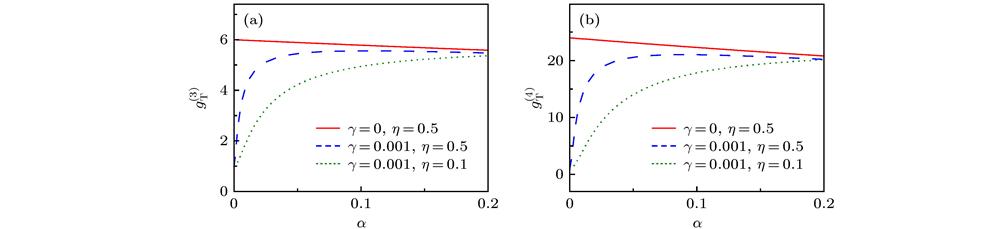
Fig. 2. (a) Third-order, and (b) fourth-order photon correlations
 and
and
 of single-mode thermal state versus the mean photon number
 .
.
and
of single-mode thermal state versus the mean photon number
. Fig. 3. (a) Second-order, (b) third-order, and (c) fourth-order photon correlations of single-mode squeezed vacuum state versus the squeezing parameter r .
Fig. 4. The third-order (blue hollow square) and fourth-order (red solid circle) photon correlations of Fock state versus the photon number: (a)
 ,
,
 ; (b)
; (b)
 ,
,
 .
.
,
; (b)
,
. Fig. 5. Schematic illustration of the experimental setup (ISO, isolator; HWP, half-wave plate; PBS, polarized beam splitter; M1, M2, mirror; L, optical lens; RGGD, rotating ground glass disk; BS1, BS2, BS3, beam splitter; D1, D2, D3 and D4, single photon counting module, SPCM; DAS, data acquisition system).
Fig. 6. Measured (a) third-order and (b) fourth-order photon correlations of thermal state and coherent state versus the counting rate for resolution time of 210 ns. The red and blue solid lines are the ideal results of the high-order photon correlations of thermal state and coherent state.
Fig. 7. Measured (a) third-order and (b) fourth-order photon correlations of thermal state and coherent state versus the resolution time for counting rate of 80 kc/s. The red and blue solid lines are the ideal results of the high-order photon correlations of thermal state and coherent state.
Fig. 8. Measured third-order photon correlation of thermal state versus delay times for resolution times of 210 ns and counting rate of 80 kc/s. The blue dots and black solid curves are the experimental and theoretical results, respectively: (a) τ 2 = 0 μs; (b) τ 2 = –10 μs; (c) τ 2 = 10 μs. The peak value of g (3) in Fig. (a) is
 .
.
. Fig. 9. The fourth-order photon correlations of thermal state at complete time delays for (a) τ 3 = 0 μs, (b) τ 3 = –10 μs, (c) τ 3 = 10 μs. The peak value of g (4) in Fig. (a) is
 .
.
. Fig. 10. Measured fourth-order photon correlation of thermal state versus delay time τ1 for resolution times of 210 ns and counting rate of 80 kc/s. The dots are the experimental results, and the black solid curves are the theoretical fittings.

Set citation alerts for the article
Please enter your email address
© Copyright 2018-2021 | Chinese Laser Press. All Rights Reserved 沪ICP备15018463号-20