• Photonics Research
  • Vol. 1, Issue 2, 96 (2013)
Alexandre Goy* and Demetri Psaltis
Author Affiliations
  • École polytechnique fédérale de Lausanne (EPFL), 1015 Lausanne, Switzerland
  • show less
    DOI: 10.1364/PRJ.1.000096 Cite this Article Set citation alerts
    Alexandre Goy, Demetri Psaltis. Imaging in focusing Kerr media using reverse propagation [Invited][J]. Photonics Research, 2013, 1(2): 96 Copy Citation Text show less
    Sensitivity to noise of high-intensity features. (a) Input of the simulation: super-Gaussian beam modulated in amplitude (25% modulation) by an image (portrait of Sir Isaac Newton by Godfrey Kneller). (b) Output after nonlinear propagation showing constellation patterns and filaments. The same perturbation in amplitude is added in points 1 and 2. (c) Reconstruction showing a defect on point 2 where the intensity in the output was larger. In point 1, the perturbation is not visible. Axis units are pixels of the simulation grid. The real size of the image is 3 mm by 3 mm, the propagation distance is 100 mm, n0=1.38, n2=2.4·10−19 m2/W, and the peak intensity is 1.8·1013 W/m2 at λ=800 nm.
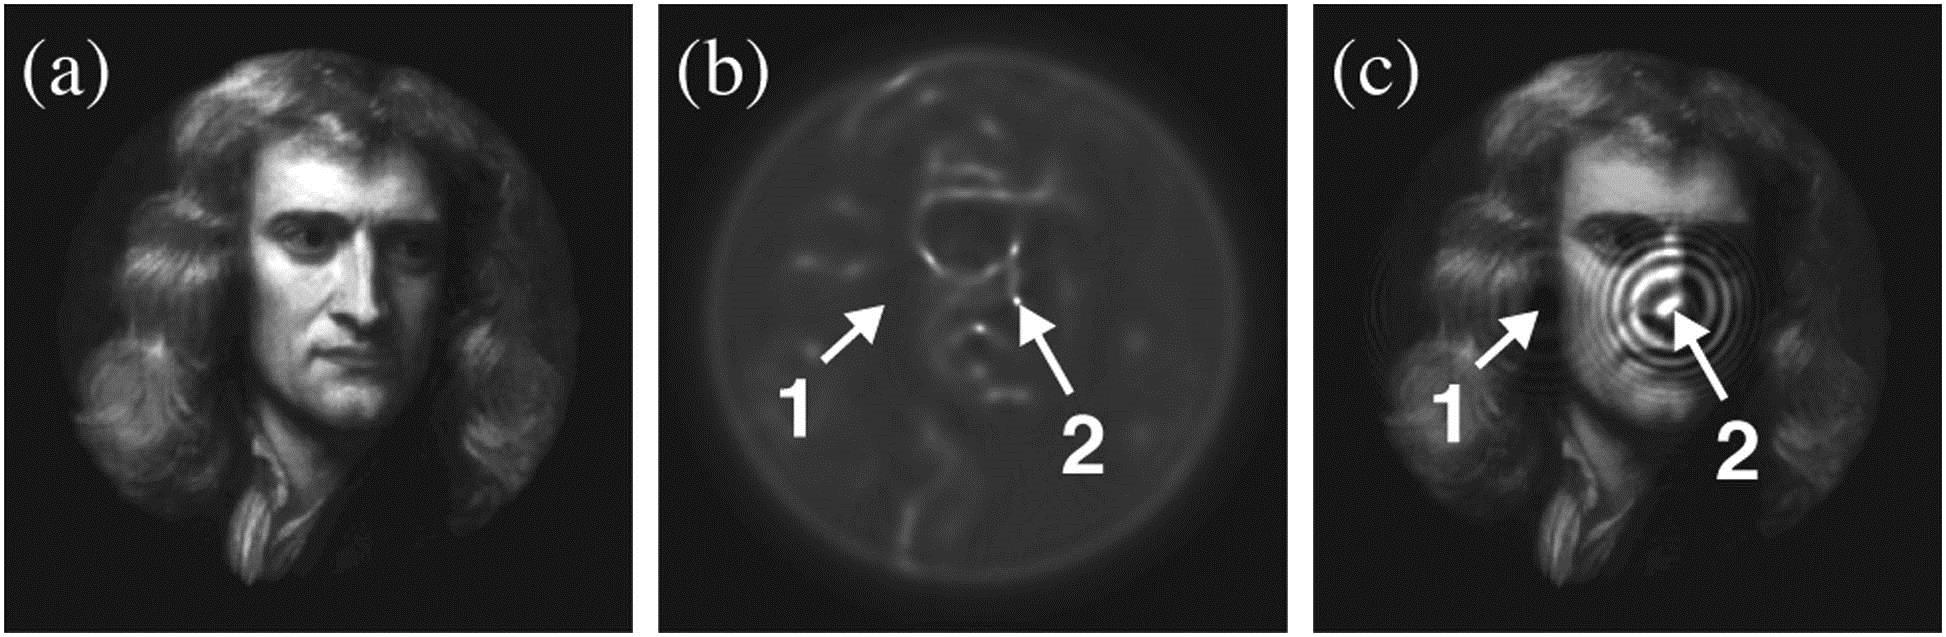
    Fig. 1. Sensitivity to noise of high-intensity features. (a) Input of the simulation: super-Gaussian beam modulated in amplitude (25% modulation) by an image (portrait of Sir Isaac Newton by Godfrey Kneller). (b) Output after nonlinear propagation showing constellation patterns and filaments. The same perturbation in amplitude is added in points 1 and 2. (c) Reconstruction showing a defect on point 2 where the intensity in the output was larger. In point 1, the perturbation is not visible. Axis units are pixels of the simulation grid. The real size of the image is 3 mm by 3 mm, the propagation distance is 100 mm, n0=1.38, n2=2.4·1019m2/W, and the peak intensity is 1.8·1013W/m2 at λ=800nm.
    Experimental apparatus for nonlinear imaging experiments. The general structure is that of an interferometer. The object is placed in the signal beam and is projected onto the input window of the nonlinear medium (glass cell filled with acetone) by a 4f lens arrangement. The output window of the medium is imaged onto a CCD camera. The reference beam is introduced at an angle for the recording of off-axis digital holograms.
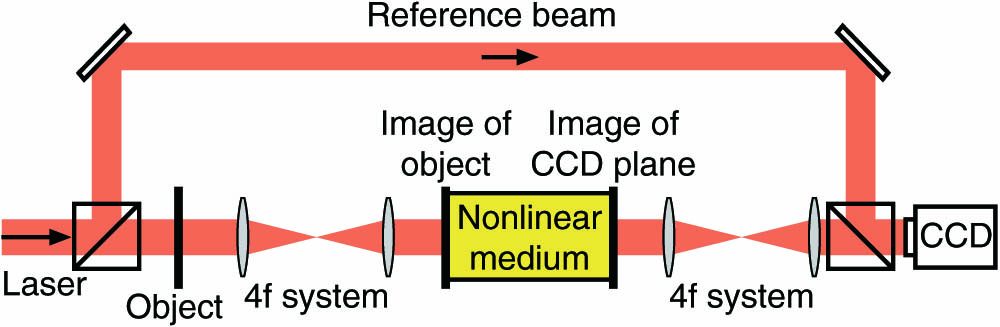
    Fig. 2. Experimental apparatus for nonlinear imaging experiments. The general structure is that of an interferometer. The object is placed in the signal beam and is projected onto the input window of the nonlinear medium (glass cell filled with acetone) by a 4f lens arrangement. The output window of the medium is imaged onto a CCD camera. The reference beam is introduced at an angle for the recording of off-axis digital holograms.
    Reconstruction of an object by DRP from experimental digital off-axis holograms. The object is a label digit in a 1951 US Air Force resolution chart illuminated with a plane wave. The images in the first two columns are the amplitude and the phase of the recorded holograms for different pulse energies. The third and fourth columns show the amplitude and the phase of the corresponding nonlinear reconstruction. Axes are in millimeters, the propagation distance is 23 mm, and λ=800 nm. In the reconstructed phase (fourth column), the slow variation of the phase across the pattern is due to the curvature of the incident wave front.
    Fig. 3. Reconstruction of an object by DRP from experimental digital off-axis holograms. The object is a label digit in a 1951 US Air Force resolution chart illuminated with a plane wave. The images in the first two columns are the amplitude and the phase of the recorded holograms for different pulse energies. The third and fourth columns show the amplitude and the phase of the corresponding nonlinear reconstruction. Axes are in millimeters, the propagation distance is 23 mm, and λ=800nm. In the reconstructed phase (fourth column), the slow variation of the phase across the pattern is due to the curvature of the incident wave front.
    This graph shows the evolution of the inner product p as a function of pulse energy. The dashed curve corresponds to a linear experiment. The optimum is reached for the lowest energy as expected. The solid curve corresponds to a nonlinear experiment. The optimum is reached for some finite pulse energy that corresponds to the actual energy in the experiment. The value of n2 can be inferred from this kind of measurement.
    Fig. 4. This graph shows the evolution of the inner product p as a function of pulse energy. The dashed curve corresponds to a linear experiment. The optimum is reached for the lowest energy as expected. The solid curve corresponds to a nonlinear experiment. The optimum is reached for some finite pulse energy that corresponds to the actual energy in the experiment. The value of n2 can be inferred from this kind of measurement.
    (a) Best reconstruction energy versus measured power. (b) Quality of the reconstruction as a function of pulse power. (c) Relative improvement p of the nonlinear reverse propagation over the linear reverse propagation. When the power is low, the improvement we can get by using the nonlinear DRP is small and gets larger as the power increases. If the power is very large and many filaments form, the nonlinear DRP will only worsen the reconstruction by introducing parasitic filaments. There is an in-between region where the nonlinear DRP is optimally used. The drop between 40 and 50 μJ corresponds to the occurrence of filaments in the measurements.
    Fig. 5. (a) Best reconstruction energy versus measured power. (b) Quality of the reconstruction as a function of pulse power. (c) Relative improvement p of the nonlinear reverse propagation over the linear reverse propagation. When the power is low, the improvement we can get by using the nonlinear DRP is small and gets larger as the power increases. If the power is very large and many filaments form, the nonlinear DRP will only worsen the reconstruction by introducing parasitic filaments. There is an in-between region where the nonlinear DRP is optimally used. The drop between 40 and 50 μJ corresponds to the occurrence of filaments in the measurements.
    Time-dependent SSF-BPM simulation of the propagation of a 150 fs pulse, taking SPM and dispersion into account, and the corresponding experimental images. The similarity of the observed defect in experiment and simulation suggests that time-dependent SPM is the main factor that impairs the image quality at high pulse energies.
    Fig. 6. Time-dependent SSF-BPM simulation of the propagation of a 150 fs pulse, taking SPM and dispersion into account, and the corresponding experimental images. The similarity of the observed defect in experiment and simulation suggests that time-dependent SPM is the main factor that impairs the image quality at high pulse energies.
    Regimes of nonlinear propagation. Applicability of the DRP as a function of propagation power.
    Fig. 7. Regimes of nonlinear propagation. Applicability of the DRP as a function of propagation power.
    Alexandre Goy, Demetri Psaltis. Imaging in focusing Kerr media using reverse propagation [Invited][J]. Photonics Research, 2013, 1(2): 96
    Download Citation