We present imaging experiments in focusing Kerr media using digital holography and digital reverse propagation (DRP) of the wave. For moderate power, the nonlinear DRP algorithm can be used to improve the quality of images over the linear DRP. We discuss the limits of the method at high power, the role of small-scale filaments, and the problem of time-dependent self-phase modulation.
Imaging in transparent linear media is achieved by using lenses, which compensate for the phase accumulated through free-space propagation. In Kerr media, the situation is different because the light itself creates variations of the refractive index through the Kerr law: where is the effective refractive index, is the linear (low intensity) refractive index, is the nonlinear refractive index or Kerr coefficient, and () is the light intensity. The intensity-dependent effects of propagation in Kerr media cannot be compensated by static and passive elements such as lenses. However, imaging can still be performed in nonlinear media provided that (1) the complex optical field can be measured, (2) the equation of propagation is known, and (3) the medium is deterministic (no loss of information). The first condition can be satisfied through the use of digital holography. Although it suffers from limitations when the nonlinearity becomes strong, as will be shown later, digital holography has been used successfully for nonlinear imaging [1].
The second condition can also be also satisfied. For a continuous wave, the propagation in homogeneous Kerr media can be described by the nonlinear Helmholtz equation (NLHE) or its paraxial approximation, the nonlinear Schrödinger equation (NLSE) [2]: where is the amplitude of the electric field, is the slowly varying envelope of the field defined by , is the effective -vector including the nonlinear contribution, is the -vector in vacuum, , and the nonlinear refractive index with . The NLHE and NLSE are efficiently solved with the split-step Fourier beam propagation method (SSF-BPM) [3]. An image of the object is obtained from the measured field by digital reverse propagation (DRP) [4], which consists in propagating the measured field backward to the object plane using the SSF-BPM.
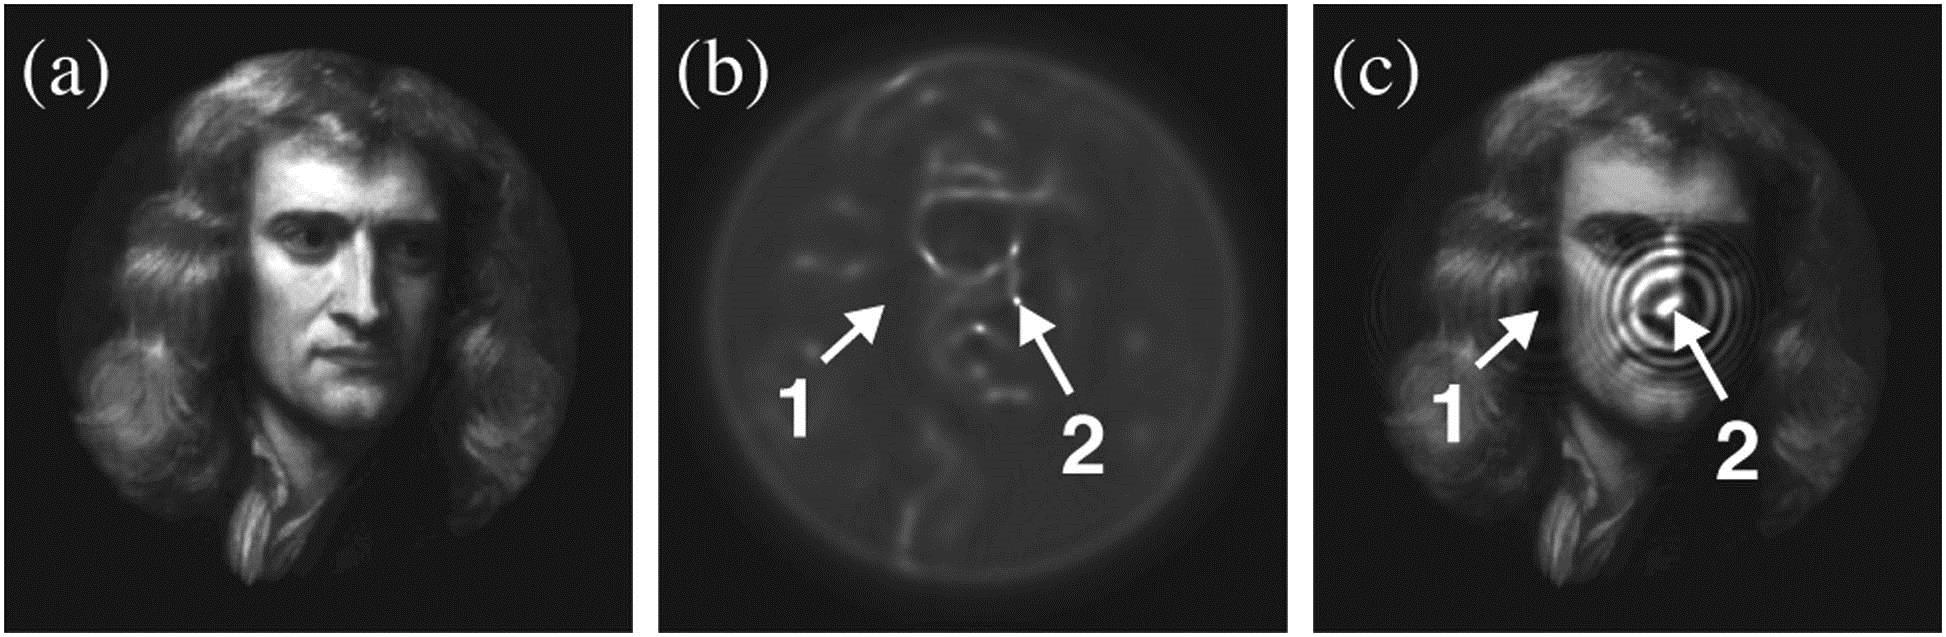
In principle, the third condition about determinism is also satisfied in focusing Kerr media () because there is a deterministic relationship (the Kerr law) that relates the intensity of the wave and the scattering potential. However, the process of small-scale filamentation [2] that sets in at high power introduces a stochastic component into the propagation [5]. Small-scale filaments (hereafter simply filaments) play a critical role in imaging as illustrated by the simulation shown in Fig. 1. In this simulation, an amplitude object (here a portrait of Isaac Newton) is illuminated with a plane wave [Fig. 1(a)] and the field propagates for some distance. In this example, the Fresnel number is much larger than one () so that diffraction effects are rather small. Self-focusing occurs as a consequence of the Kerr effect, and the optical power gathers in web-like patterns called constellations [6] [Fig. 1(b)]. Eventually, filaments are formed along the constellation patterns. The fact that constellations form along the edges of the original object is characteristic of self-focusing. This is especially prominent when the object is large, as in this example (3 mm by 3 mm). The field in Fig. 1(b) is the quantity extracted from the measured digital hologram. We apply the DRP on this simulated field and recover the object [Fig. 1(a)]. In order to illustrate the sensitivity of the DRP process to measurement noise, we disturb the measured field by adding small-amplitude perturbations [marked 1 and 2 in Fig. 1(b)]. One is located in a low-intensity region (point 1) and the other on a filament (point 2). On the reconstruction [Fig. 1(c)] a defect is visible in point 2, whereas there is nothing noticeable in point 1, even though the perturbations are initially the same.
Sign up for Photonics Research TOC. Get the latest issue of Photonics Research delivered right to you!Sign up now
Figure 1.Sensitivity to noise of high-intensity features. (a) Input of the simulation: super-Gaussian beam modulated in amplitude (25% modulation) by an image (portrait of Sir Isaac Newton by Godfrey Kneller). (b) Output after nonlinear propagation showing constellation patterns and filaments. The same perturbation in amplitude is added in points 1 and 2. (c) Reconstruction showing a defect on point 2 where the intensity in the output was larger. In point 1, the perturbation is not visible. Axis units are pixels of the simulation grid. The real size of the image is 3 mm by 3 mm, the propagation distance is 100 mm, , , and the peak intensity is at .
For moderate power, imaging is thus possible in Kerr media. This was first demonstrated experimentally in 2009 in a photorefractive crystal with defocusing nonlinearity () [1]. We demonstrate imaging experiments in a focusing Kerr medium and show the experimental limit of reverse propagation as filaments start to appear at high powers.
2. EXPERIMENTAL METHOD
The experimental apparatus is depicted in Fig. 2. It consists of a Mach–Zehnder interferometer with one arm containing the object and the nonlinear medium and the other arm serving as a reference. The nonlinear medium is acetone ( at 800 nm and 20°C, ) and is contained in a silica cell with a 10 mm long optical path. The critical power for self-focusing [2] is equal to , which corresponds to a critical pulse energy for 150 fs pulse duration. An amplitude object (in this case, a 1951 US Air Force resolution target with clear patterns and opaque background) is illuminated with a collimated laser beam of 7 mm FWHM and a quality factor . The laser is a Ti:sapphire regenerative amplifier tuned at 800 nm and producing 150 fs pulses with energy up to 2 mJ per pulse. The object is imaged onto the input window of the acetone cell with a lens system with unit magnification. Another system is used to image the output of the cell onto an Apogee CCD camera with 6.8 μm pixels. The complex field on the CCD is measured through conventional off-axis digital holography. The energy of the pulse is modulated with a variable neutral-density filter and is monitored with a photodiode. In Fig. 2, the measured spectrum of the femtosecond amplifier is shown.
Figure 2.Experimental apparatus for nonlinear imaging experiments. The general structure is that of an interferometer. The object is placed in the signal beam and is projected onto the input window of the nonlinear medium (glass cell filled with acetone) by a lens arrangement. The output window of the medium is imaged onto a CCD camera. The reference beam is introduced at an angle for the recording of off-axis digital holograms.
For the object reconstruction, the DRP is implemented using the following SSF-BPM scheme: where is the optical field complex amplitude, FFT stands for the fast Fourier transform in and , and is the propagation step along the propagation direction. is the propagation phase factor given by [3] where , are the spatial frequencies and .
We briefly discuss here the minimal resolution of the spatial discretization that is needed to properly simulate the propagation of the wave in focusing Kerr media. The sampling frequency has to meet the Nyquist criterion, which states that it must be at least two times larger than the highest frequency in the signal. In principle, for linear propagation to be possible at all angles, the pixel size has to be smaller than . Waves with higher spatial frequency are evanescent and do not propagate. If the system is linear, they will not couple to propagating modes either so that the largest spatial frequency that we need to be able to represent is . In a linear system again, the size of the step in the direction is not important because the phase accumulated by each plane-wave component is only dependent on the propagation angle of the wave, which is constant. This is not the case in nonlinear media, in which the phase of each plane wave is locally modulated by the intensity of the total field. Assuming that we know in advance the maximum intensity and the largest spatial frequency reached by the field during propagation, we can derive the maximal values for , , and . For , , we simply apply the Nyquist criterion, that is, we need to have , and we get
As we do not know in advance, our strategy is to run the simulation several times with increasing resolutions until the widest spatial spectrum falls in the computation window. The step in the direction has to be small enough to represent the fastest phase change undergone locally by individual plane-wave components. This means that the phase of this wave has to change by less than over a distance . The maximum nonlinear phase shift will occur where the field reaches and is given by , so that
The maximum intensity can be estimated by assuming that all the initial power may be concentrated at some point in a Gaussian spot of waist , so that . It is then instructive to rewrite Eq. (8) in term of the critical power. We get
Note that in the case of filamentation, the power of the filament does not exceed the critical power. It is thus unlikely that any region of the field will have an intensity exceeding the intensity of a single filament. Using should be sufficient in most cases.
3. RESULTS
The results of the imaging experiment are shown in Fig. 3. The object is a label digit in a 1951 US Air Force resolution target. The total propagation distance between the two imaging planes of Fig. 2 is 23 mm (10 mm in acetone, 2 mm in the glass, and the rest in air), and the width of the label stroke is 125 μm, which gives a Fresnel number of 0.85. In the first two columns of Fig. 3, we show the amplitude and the phase of the measured field as they have been extracted from the digital hologram. In the two columns on the right, we show the amplitude and the phase of the reconstructed objects obtained with the nonlinear DRP. Each row in Fig. 3 corresponds to a different pulse energy. We see that, for low energy (8.5 μJ), the object can be reconstructed without any major defect. At intermediate energy (37 μJ), a slight edge enhancement starts to appear on the amplitude of the reconstruction. This is also visible in the phase in which we can see ripples parallel to the edges. At high energy (52 μJ), filaments have appeared in the detected field (first column, last row); they are quite apparent in the phase image in the second column. The effect of the filaments is quite dramatic in the reconstruction. The strong phase perturbation provoked by self-focusing has not been fully corrected and propagates back to the image.
Figure 3.Reconstruction of an object by DRP from experimental digital off-axis holograms. The object is a label digit in a 1951 US Air Force resolution chart illuminated with a plane wave. The images in the first two columns are the amplitude and the phase of the recorded holograms for different pulse energies. The third and fourth columns show the amplitude and the phase of the corresponding nonlinear reconstruction. Axes are in millimeters, the propagation distance is 23 mm, and . In the reconstructed phase (fourth column), the slow variation of the phase across the pattern is due to the curvature of the incident wave front.
One problem faced when using the DRP on experimental measurements is that the power needed for the reconstruction is not known precisely. In experiments, it is possible to measure the power of the whole beam, but knowing exactly the power of the object at the entrance window of the nonlinear medium is more difficult. Moreover, the uncertainty on the coefficient is usually a few percent. An error in the power used for the reverse propagation acts as a perturbation. It is possible to solve this problem by performing several reconstructions by scanning the power within a reasonable range. This approach requires a criterion to assess the quality of the reconstruction. The quality criterion we used for a particular reconstruction was the inner product between that reconstruction and the reconstruction from the lowest-energy experiment that serves as a reference object. In the experiment described above, the reference object is the reconstruction at 8.5 μJ (Fig. 3, first row, right columns). We define as where denotes the nonlinear reconstruction and the low-power reference object. The bar denotes the average, and the summation applies on all the pixels. The low-power reconstruction can serve as a reference because it incorporates all the aberrations of the optical system so that the distortions observed at higher power are due to nonlinearity only. In Fig. 4, we show the evolution of for linear and nonlinear experiments. The optimum in the curve should correspond to the pulse energy actually used in the experiment. In Fig. 4, image A is the reconstruction for a linear experiment and serves as a reference object; hence for this image. Image B is a low-energy (linear) reconstruction from a nonlinear experiment. Because of the mismatch between the actual energy and the assumed energy used in the reconstruction, the pattern is blurred and parasitic light fills the pattern (image B). If we perform reconstruction with increasing energy, we reach an optimum in term of at point C. The optimal reconstruction C does not look as good as the reference object A but is still better than the linear reconstruction B. The improvement obtained by using the optimal reconstruction energy is weak but is not accidental and is observed systematically in all similar experiments. In general, the value at the optimum decreases with increasing pulse energy. In Fig. 4, for instance, point C stands at a lower value than point A. This means that the quality of the reconstruction decreases with stronger nonlinearity, as may be expected. We provide a specific explanation for this effect later on. In general, the object is not known, and it is therefore not possible to optimize the reconstruction energy by maximizing the inner product . A criterion involving a priori information about the object, such as sharpness of the reconstruction, has to be used. The result presented above serves the purpose of demonstrating the interesting fact that an optimal reconstruction power actually exists, and it is proportional to the power used in the experiment.
Figure 4.This graph shows the evolution of the inner product as a function of pulse energy. The dashed curve corresponds to a linear experiment. The optimum is reached for the lowest energy as expected. The solid curve corresponds to a nonlinear experiment. The optimum is reached for some finite pulse energy that corresponds to the actual energy in the experiment. The value of can be inferred from this kind of measurement.
The optimization of the reconstruction based on the inner product can find an application in measuring the nonlinear refractive index of the medium in case it is not known. For this, both the object and the physical energy used in the measurement have to be known. If this is the case, optimizing the energy is equivalent to optimizing the value of . This is true because the change in the refractive index due to the optical Kerr effect depends only on the product .
The correspondence between the optimal reconstruction energy and the measured energy of the pulse is shown in Fig. 5(a) for different pulse energies. The linear relationship between the two quantities indicates that the optimal energy can be used safely as the actual energy for reconstruction, at least up to 40 μJ. Beyond this value, the nonlinear distortion becomes too large and the maximum in the inner product does not correspond to an optimum. The quality of the linear and nonlinear reconstructions is plotted in Fig. 5(b), where the sudden drop in image quality after 40 μJ can be observed. Both linear and nonlinear image qualities decrease with increasing energy, but the nonlinear reconstructions are always slightly better. At low energies, the nonlinear distortion is weak and we could simply use the linear reverse propagation. In Fig. 5(c), we show the actual improvement that is obtained by the use of the nonlinear reverse propagation. The relative improvement plotted in Fig. 5(c) is defined as where and are the inner products for the linear and nonlinear reconstructions, respectively. Intuitively, we expect the improvement to be very weak for low energies as the linear and nonlinear propagation give approximately the same result. At very high energy, we expect the nonlinear reverse propagation to be very different from the linear, thus providing a larger improvement. This is not true any more when filaments form because the nonlinear reverse propagation fails completely and introduces parasitic filaments in the reconstruction. There is thus an optimal pulse energy range in which the nonlinear DRP improves the reconstruction.
Figure 5.(a) Best reconstruction energy versus measured power. (b) Quality of the reconstruction as a function of pulse power. (c) Relative improvement of the nonlinear reverse propagation over the linear reverse propagation. When the power is low, the improvement we can get by using the nonlinear DRP is small and gets larger as the power increases. If the power is very large and many filaments form, the nonlinear DRP will only worsen the reconstruction by introducing parasitic filaments. There is an in-between region where the nonlinear DRP is optimally used. The drop between 40 and 50 μJ corresponds to the occurrence of filaments in the measurements.
The failure of the DRP at high power can be partially explained by the fact that the wave is assumed to be continuous when the hologram is measured. This is not the case as the experiments are performed with a pulsed laser. The pulse has an intensity that is time-dependent. Thus, the self-phase modulation (SPM) and the associated phase shift are also time-dependent. This implies that, within the time frame of the pulse, the interference fringes will move in the hologram. The integration time of the detector is much longer than the duration of the pulse. As a consequence, the fringes get blurred in the region where the SPM is large, which is mainly in the vicinity of filaments.
In order to investigate this issue, it is possible to include the time dependence in the DRP and simulate an experiment. This is done by adding the time dimension to the field , which becomes , where is the time in the reference frame moving at the group velocity of the pulse. The time profile of the initial pulse is assumed to be Gaussian with a FWHM of 150 fs.
A dispersion term is added to Eq. (3), which becomes where is the second-order dispersion term. The factor given by Eq. (6) is changed to , and the two-dimensional FFT is replaced by the three-dimensional FFT in , , and .
In Fig. 6, we show the result of linear and nonlinear reconstruction experiments and the simulations that correspond to them. The simulations were performed with the time-dependent SSF-BPM described above. The type of defect observed in the simulated reconstruction is quite similar to what is observed in the experiments. There is a characteristic edge enhancement that is also visible in the experiment shown in Fig. 3. This feature can be explained as follows. Sharp objects such as circular or rectangular apertures such as those shown in Figs. 3 and 6 have a sinc-shaped diffraction pattern. Most of the power is contained in a main central lobe. The side lobes are weaker and contain the high frequencies, which is the information needed to recover the sharp edges of the object. As mentioned above, because of SPM and dispersion, the visibility of the interference fringes is reduced in large-intensity regions, such as the main lobe of the diffraction pattern. The power contained in the central lobe extracted from the hologram is reduced while the side lobes remain mainly unaffected. The holographic detection process thus acts as a high-pass filter, which explains the observed edge enhancement. At low power, the object can be reconstructed without major defects. In the linear case, there is no reason to expect a time dependence of the phase; thus the fringes remain fixed. In the nonlinear case, both in simulation and experiment, there is a clear reduction in the contrast of the fringes around the filaments. The consequence of this is a reduction of the amplitude of the field reconstructed from the hologram in the corresponding regions (dark rims around the filaments). This apparent weakening of the field has dramatic consequence in the nonlinear case because the intensity controls the evolution of the phase through the Kerr effect during reverse propagation.
Figure 6.Time-dependent SSF-BPM simulation of the propagation of a 150 fs pulse, taking SPM and dispersion into account, and the corresponding experimental images. The similarity of the observed defect in experiment and simulation suggests that time-dependent SPM is the main factor that impairs the image quality at high pulse energies.
Filaments thus play an important role in the reversibility of the image. One aspect of the problem is that filaments are associated with strong SPM and dispersion as observed in the experiment described above. In some cases, plasma is formed and four-wave mixing processes occur. Apart from these phenomena, filaments may be intrinsically difficult to invert. In most situations a higher-order defocusing nonlinear term, such as , can contribute and transform the filament into a stable propagating soliton-like entity [6,7]. Such propagation-invariant fields are not invertible. However, when part of the field converges to a stable filament, the light that does not fit into this mode is scattered away. If this initially scattered light is collected together with the filament, it becomes possible to invert it. However, the inversion procedure will be highly sensitive to noise and is not likely to be successful on experimental data.
5. CONCLUSION
We experimentally demonstrated the possibility of imaging in focusing Kerr media as long as filaments do not form during propagation. Even though there is no fundamental limitation in imaging through nonlinear media provided that no information is lost, the situation is quite different in practice. As demonstrated with the example shown in Fig. 1 and also in the literature [5,8–10], filaments introduce a stochastic component in the propagation because their phase is highly unstable. Moreover, the holography process we use does not allow us to record the time information in addition to the two spatial dimensions of the image. At high pulse energies, the SPM cannot be considered constant any more and the simple continuous-wave DRP fails to reconstruct the object properly. The fact that very similar defects are observed in the corresponding simulation indicates that time-dependent SPM is the major source of error at high energy. As shown in Fig. 7, the applicability of the DRP algorithm in focusing Kerr media can be summarized as follows: At low power, when , linear imaging is valid and lenses can be used to form images. For , nonlinear DRP can be used and provides an improvement over the linear DPR. From up to a few , the time dependence of the SPM affects the reconstruction. This could be solved if we could record the time information and include it in the nonlinear DRP. At larger power, filaments start to form and reconstruction becomes very difficult because of the phase instability. The upcoming challenge is to devise a system that enables us to record the time dependence of the hologram in order to extend the range of validity of the nonlinear DRP.
Figure 7.Regimes of nonlinear propagation. Applicability of the DRP as a function of propagation power.