• High Power Laser and Particle Beams
  • Vol. 34, Issue 2, 026005 (2022)
Lei Cao1、2, Yaofeng Zhang1, Yang Yang2, Jianwei Huang2、*, and Xiaole Zhang2
Author Affiliations
  • 1College of Nuclear Science and Technology, Beijing normal university, Beijing 100875, China
  • 2Institute of Ionizing Radiation Metrology, National Institute of Metrology, Beijing 100013, China
  • show less
    DOI: 10.11884/HPLPB202234.210300 Cite this Article
    Lei Cao, Yaofeng Zhang, Yang Yang, Jianwei Huang, Xiaole Zhang. Measurement of environmental level X, γ dose with conversion of complete spectra without deconvolution method of MC simulation[J]. High Power Laser and Particle Beams, 2022, 34(2): 026005 Copy Citation Text show less
    CT images of HPGe detector
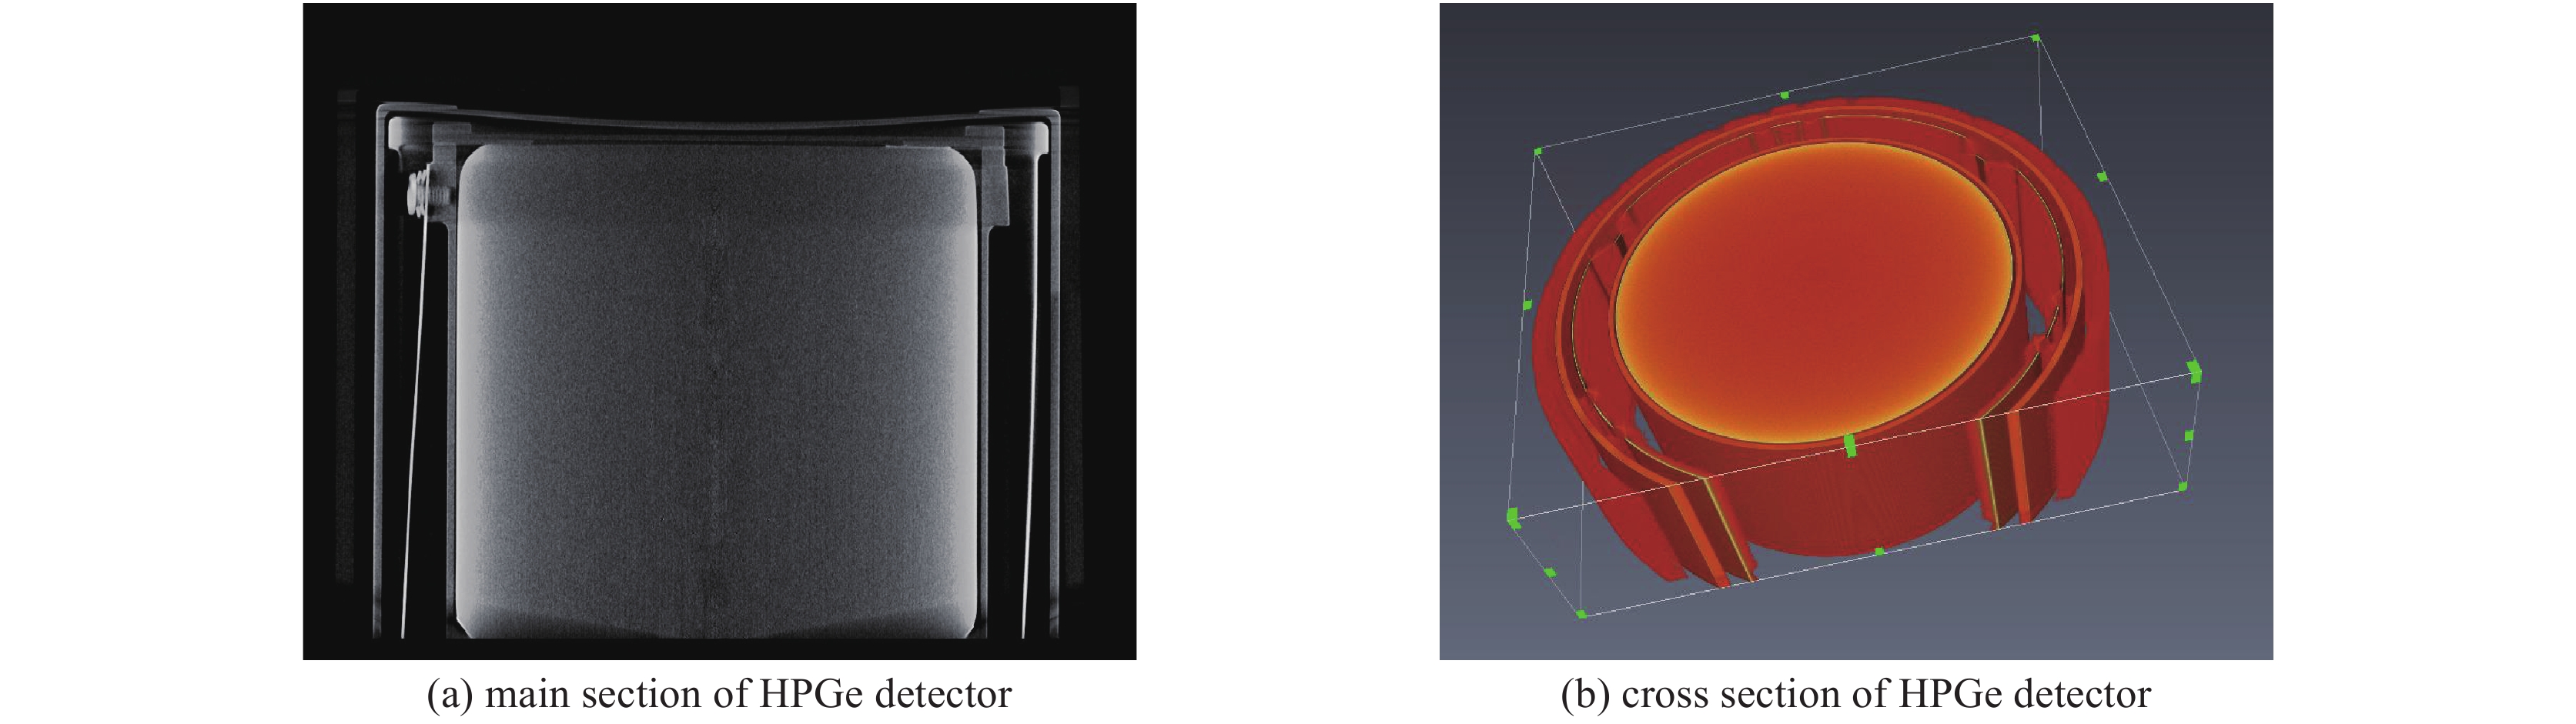
    Fig. 1. CT images of HPGe detector
    Schematic diagram of MCNP model of HPGe detector
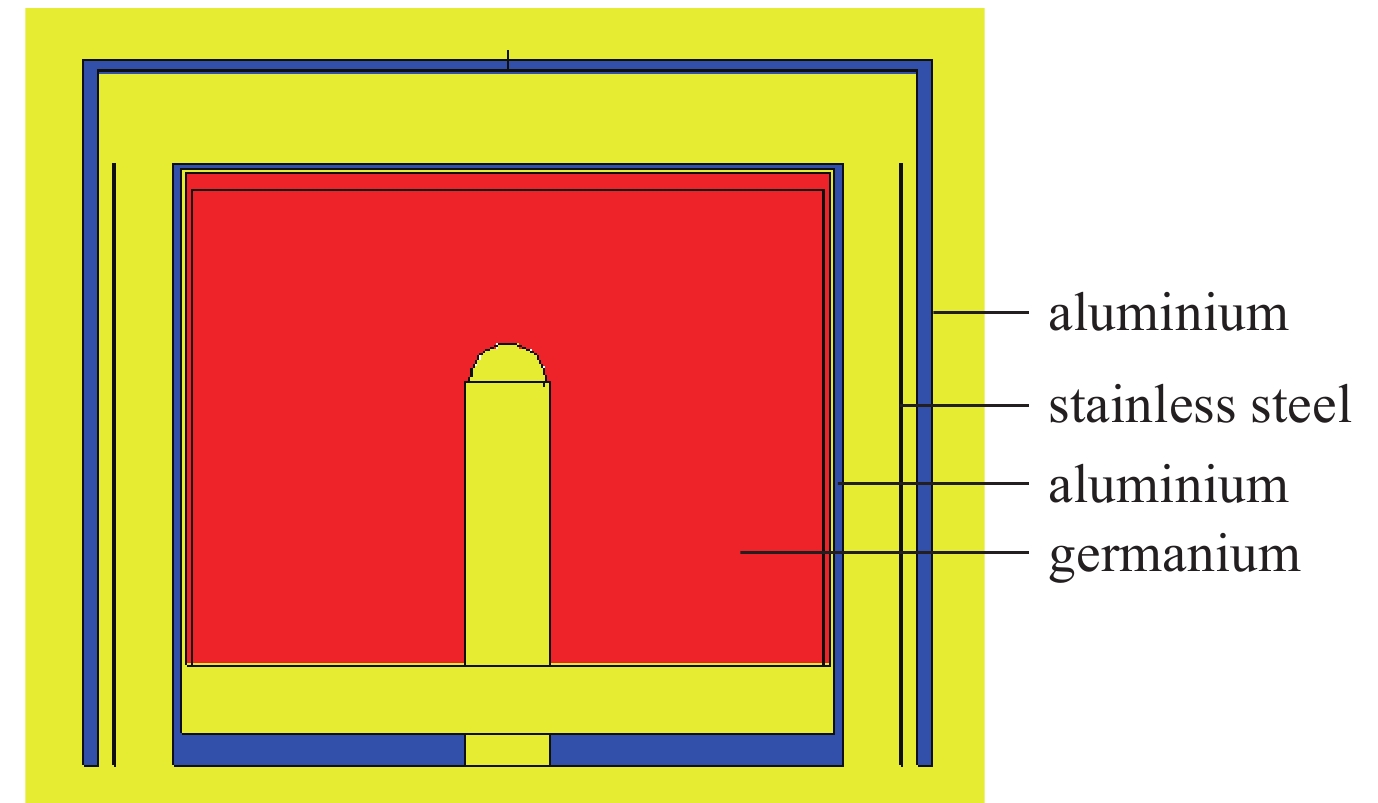
    Fig. 2. Schematic diagram of MCNP model of HPGe detector
    Diagram of calibration measuring situation for HPGe detector
    Fig. 3. Diagram of calibration measuring situation for HPGe detector
    Comparison of experimental detection efficiency and simulated detection efficiency
    Fig. 4. Comparison of experimental detection efficiency and simulated detection efficiency
    Experimental device for measuring radioactive source with high purity germanium detector
    Fig. 5. Experimental device for measuring radioactive source with high purity germanium detector
    Experimental device for measuring radioactive sources in a 10L spherical ionization chamber
    Fig. 6. Experimental device for measuring radioactive sources in a 10L spherical ionization chamber
    Energy spectrum of different energies simulated by MCNP
    Fig. 7. Energy spectrum of different energies simulated by MCNP
    Energy spectrum of Co-60 and Cs-137 simulated by MCNP
    Fig. 8. Energy spectrum of Co-60 and Cs-137 simulated by MCNP
    Results of G and GE for energy group No. 1
    Fig. 9. Results of G and GE for energy group No. 1
    Results of G and GE for energy group No. 2
    Fig. 10. Results of G and GE for energy group No. 2
    Energy spectrum of Co-60 of high purity germanium detector
    Fig. 11. Energy spectrum of Co-60 of high purity germanium detector
    Energy spectrum of Cs-137 of high purity germanium detector
    Fig. 12. Energy spectrum of Cs-137 of high purity germanium detector
    radioactive sourceenergy/keVFWHM/MeVdetection efficiency/%
    Co-57122.062.74×10−30.239
    136.472.67×10−30.274
    Co-601173.243.44×10−30.057
    1332.513.51×10−30.052
    Cs-137661.663.36×10−30.092
    Na-221274.543.17×10−30.054
    Table 1. Result of the calibration measurement of HPGe detector
    E/keVexperimental detection efficiency/%simulated detection efficiency at different dead layer/%
    0.05 cm0.07 cm0.10 cm0.12 cm0.17 cm0.22 cm
    122.060.2780.2300.2730.2640.2500.2280.208
    136.470.2750.2930.2830.2880.2640.2450.227
    511.000.1280.0780.1190.1160.1160.1120.108
    661.660.0920.0980.0980.0910.0950.0920.089
    1173.240.0580.0310.0630.0620.0620.0600.059
    1274.540.0550.0210.0600.0580.0580.0560.055
    1332.510.0520.0290.0570.0560.0560.0540.053
    Table 2. Simulated detection efficiency results of HPGe detector with different dead layer thickness
    average energy/MeVsimulated dose rate/(nGy·h−1)dose rate of conversion of complete spectra without deconvolution method /(nGy·h−1)residue/(nGy·h−1)
    0.0551.80×10−51.80×10−50
    0.0701.72×10−51.72×10−50
    1.0002.20×10−52.20×10−50
    0.1252.82×10−52.82×10−59.83×10−20
    0.1704.11×10−54.11×10−59.49×10−20
    0.6622.00×10−32.00×10⁻³⁰
    1.2503.44×10−33.44×10−39.97×10−18
    Table 3. Dose rate of conversion of complete spectra without deconvolution method and simulation of energy group No. 2
    radioactive sourcedistance/mmeasured dose rate/(nGy·h−1)standard value of dose rate/(nGy·h−1)relative error of measured value and standard value/%
    Cs-1373.053435397−1.001
    Cs-1373.5396539620.076
    Cs-1374.030183028−0.330
    Cs-1374.52395.52396−0.021
    Co-603.013681355.4−0.921
    Co-603.51005988.5−1.642
    Co-604.0769776.10.923
    Co-604.5607602.55−0.733
    Table 4. The results of measuring the dose rate of Co-60 and Cs-137 in a 10 L spherical ionization chamber at different distances
    radioactive sourcedistance/mdose rate of conversion of complete spectra without deconvolution method/(nGy·h−1)live time rate/%standard value of dose rate/(nGy·h−1)relative error of calculated value and standard value/%
    Cs-1373.06115.90.555830.08.02
    Cs-1373.54497.10.634286.58.19
    Cs-1374.03372.50.723214.16.15
    Cs-1374.52688.60.752562.16.93
    Co-603.01363.10.921339.7−2.07
    Co-603.51010.50.93993.0−1.20
    Co-604.0770.50.95757.0−1.56
    Co-604.5609.70.96598.9−1.33
    Table 5. Comparison of dose rate of Conversion of complete spectra without deconvolution method and the standard value
    Lei Cao, Yaofeng Zhang, Yang Yang, Jianwei Huang, Xiaole Zhang. Measurement of environmental level X, γ dose with conversion of complete spectra without deconvolution method of MC simulation[J]. High Power Laser and Particle Beams, 2022, 34(2): 026005
    Download Citation