- Spectroscopy and Spectral Analysis
- Vol. 41, Issue 8, 2530 (2021)
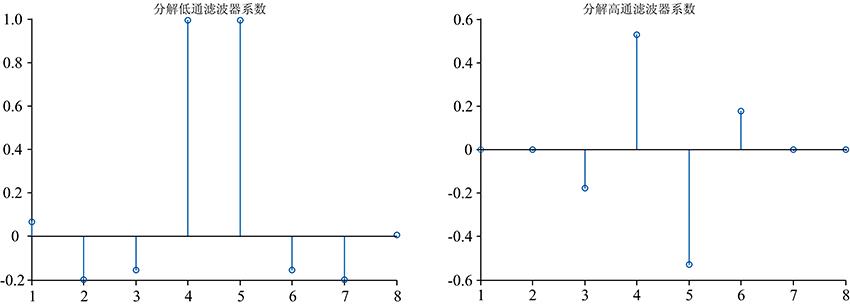
Fig. 1. Decompose low pass filter and high pass filter coefficients
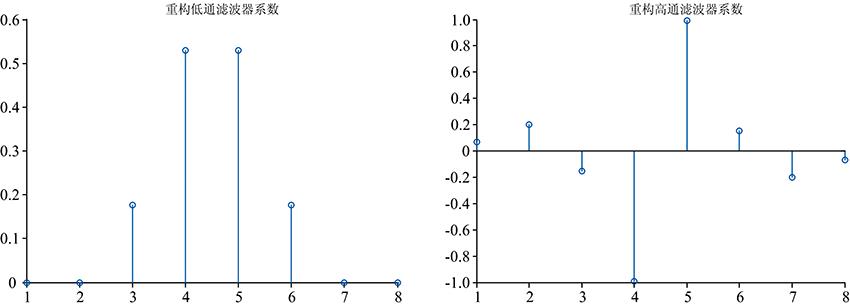
Fig. 2. Reconstructed low pass filter and high pass filter coefficients
Fig. 3. Analog signal overlap peak
Fig. 4. The fourth derivative processes the signal
Fig. 5. Overlapping peak decomposition results
Fig. 6. Overlapping peak decomposition results
Fig. 7. Decomposed results of measured T Leaded brass X-ray fluorescence spectrum
Fig. 8. X-ray Fluorescence spectrum of light element and Overlapping peak decomposition results
|
Table 1. Peak position analysis
|
Table 2. Peak position analysis
|
Table 3. Peak position analysis

Download Citation

Set citation alerts for the article
Please enter your email address
© Copyright 2018-2021 | Chinese Laser Press. All Rights Reserved 沪ICP备15018463号-20