• Journal of Geographical Sciences
  • Vol. 30, Issue 8, 1363 (2020)
Kan ZHOU1、*, Baoyin LIU2, and Jie FAN1、2
Author Affiliations
  • 1Key Laboratory of Regional Sustainable Development Modeling, Institute of Geographic Sciences and Natural Resources Research, CAS, Beijing 100101, China
  • 2Institute of Science and Development, CAS, Beijing 100190, China
  • show less
    DOI: 10.1007/s11442-020-1786-8 Cite this Article
    Kan ZHOU, Baoyin LIU, Jie FAN. Post-earthquake economic resilience and recovery efficiency in the border areas of the Tibetan Plateau: A case study of areas affected by the Wenchuan Ms 8.0 Earthquake in Sichuan, China in 2008[J]. Journal of Geographical Sciences, 2020, 30(8): 1363 Copy Citation Text show less
    Location of the study area in the border areas of the Tibetan Plateau and map of its topography (expanded inset on the right)
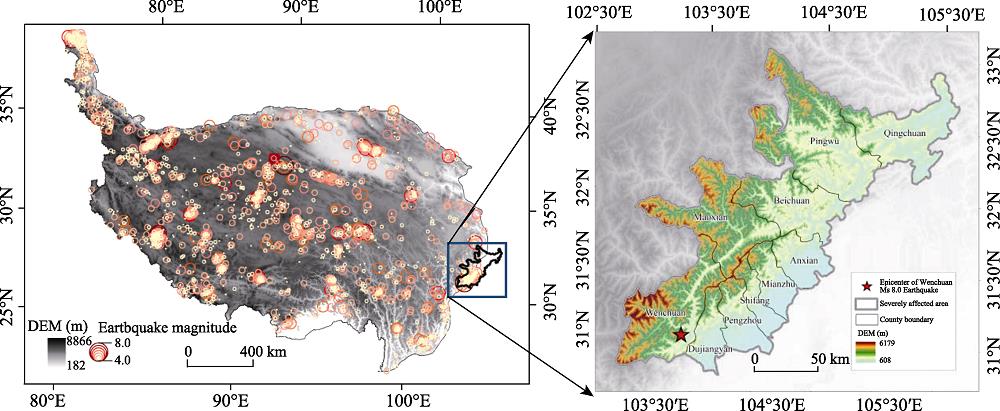
    Fig. 1. Location of the study area in the border areas of the Tibetan Plateau and map of its topography (expanded inset on the right)
    Schematic diagram of the growth trajectory of the post-disaster regional economy
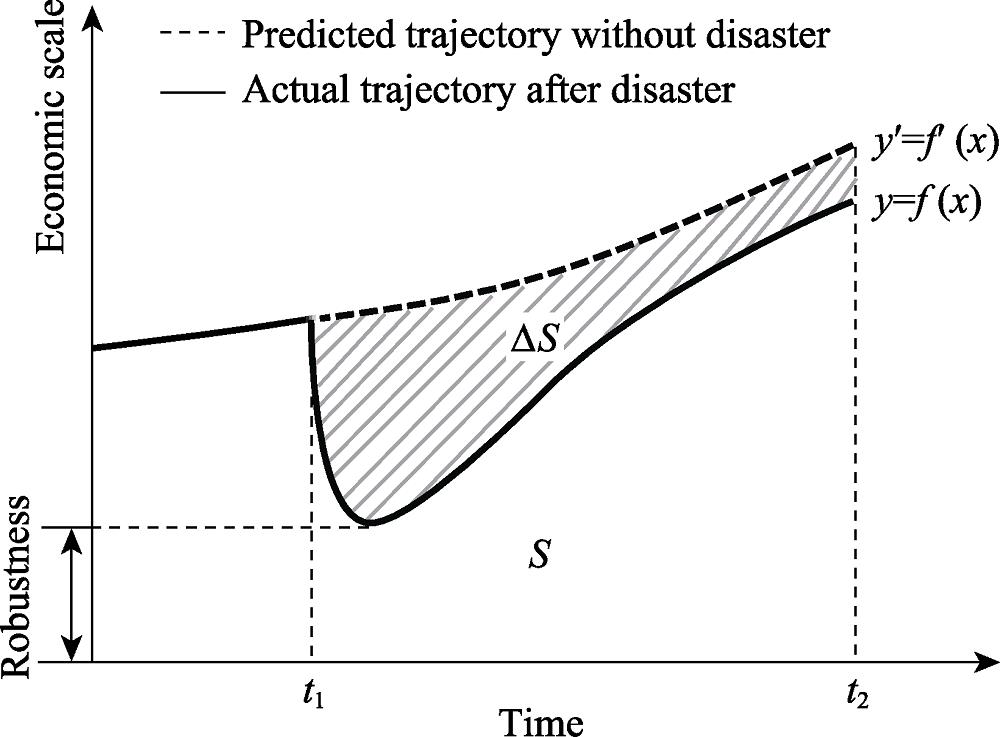
    Fig. 2. Schematic diagram of the growth trajectory of the post-disaster regional economy
    Comparison of pre-earthquake and post-earthquake GDP
    Fig. 3. Comparison of pre-earthquake and post-earthquake GDP
    Changes in GDP and added value of the three strata of industry
    Fig. 4. Changes in GDP and added value of the three strata of industry
    Differences in the recovery cycles between secondary industry and tertiary industry
    Fig. 5. Differences in the recovery cycles between secondary industry and tertiary industry
    Changes in the industrial structure of the three strata of industry
    Fig. 6. Changes in the industrial structure of the three strata of industry
    Changes in per capita GDP and coefficient of variation
    Fig. 7. Changes in per capita GDP and coefficient of variation
    Changes in total factor productivity (TFP) and its decomposition results
    Fig. 8. Changes in total factor productivity (TFP) and its decomposition results
    AreaComprehensive efficiencyPure technical efficiencyScale efficiencyReturns to scale
    Wenchuan0.5051.0000.505Increase
    Beichuan0.2931.0000.293Increase
    Mianzhu1.0001.0001.000Constant
    Shifang1.0001.0001.000Constant
    Qingchuan0.3211.0000.321Increase
    Maoxian0.2691.0000.269Increase
    Dujiangyan0.9120.9390.971Decrease
    Pingwu0.2990.5800.515Increase
    Pengzhou0.6371.0000.637Decrease
    Anxian0.7980.9810.813Increase
    Average value0.6030.9500.632
    Table 1.

    Relative efficiency of economic recovery and its decomposition results for 2008

    YearComprehensive efficiencyRate of technological changePure technical efficiencyScale efficiencyTotal factor growth rate
    20070.9241.1310.9740.9481.044
    20081.0270.6461.0530.9750.663
    20090.9570.8860.8541.1210.848
    20101.0111.0300.9881.0231.041
    20110.9301.0921.0120.9191.015
    20120.9931.0391.0600.9371.032
    20131.0191.0111.0690.9531.030
    20141.0370.9991.0291.0071.036
    20151.0370.9770.9911.0471.014
    Table 2.

    Malmquist index and its decomposition results since 2007

    Kan ZHOU, Baoyin LIU, Jie FAN. Post-earthquake economic resilience and recovery efficiency in the border areas of the Tibetan Plateau: A case study of areas affected by the Wenchuan Ms 8.0 Earthquake in Sichuan, China in 2008[J]. Journal of Geographical Sciences, 2020, 30(8): 1363
    Download Citation