• Journal of Geographical Sciences
  • Vol. 30, Issue 8, 1363 (2020)
Kan ZHOU1、*, Baoyin LIU2, and Jie FAN1、2
Author Affiliations
  • 1Key Laboratory of Regional Sustainable Development Modeling, Institute of Geographic Sciences and Natural Resources Research, CAS, Beijing 100101, China
  • 2Institute of Science and Development, CAS, Beijing 100190, China
  • show less
    DOI: 10.1007/s11442-020-1786-8 Cite this Article
    Kan ZHOU, Baoyin LIU, Jie FAN. Post-earthquake economic resilience and recovery efficiency in the border areas of the Tibetan Plateau: A case study of areas affected by the Wenchuan Ms 8.0 Earthquake in Sichuan, China in 2008[J]. Journal of Geographical Sciences, 2020, 30(8): 1363 Copy Citation Text show less

    Abstract

    The border areas of the Tibetan Plateau and the neighboring mountainous areas have a high incidence of earthquakes with a magnitude greater than Ms 5.0, as well as having a dense distribution of geological disasters such as collapses, landslides, and debris flows. Revealing the post-disaster economic development and recovery process is very important for enhancing disaster prevention and response capacity in order to formulate control policies and recovery methods for post-disaster economic reconstruction based on economic resilience. Using long-term socioeconomic data and the autoregressive integrated moving average (ARIMA) model, this paper calculated the economic resilience index of the areas most severely affected by the Wenchuan Earthquake of 2008 and adopted the improved variable returns to scale (VRS) date envelopment analysis (DEA) model and the Malmquist productivity index to analyze the efficiency and effect of annual post-disaster recovery. The results show that: (1) the economic resilience index of the areas most severely affected by the Wenchuan Earthquake was 0.877. The earthquake resulted in a short-term economic recession in the affected areas, but the economy returned to pre-quake levels within two years. In addition, the industrial economy was less resilient than agriculture and the service industry. (2) The comprehensive economic recovery efficiency of the disaster-stricken area in the year following the disaster was 0.603. The comprehensive efficiency, the pure technical efficiency, and the scale efficiency of the plain and hilly areas were significantly greater than those of the plateau and mountain areas. (3) The annual fluctuation in total factor productivity (TFP) following the disaster was considerable, and the economic recovery efficiency decreased significantly, resulting in a short-term economic recession. The TFP index returned to steady state following decreases of 33.7% and 15.2%, respectively, in the two years following the disaster. (4) The significant decrease in the post-disaster recovery efficiency was caused mainly by technological changes, and the renewal of the production system was the leading factor in determining the economic resilience following the disaster. With the decline in the scale of economic recovery following the earthquake, long-term economic recovery in the disaster-stricken areas depended mainly on pure technical efficiency, and the improvement in the latter was the driving force for maintaining the long-term growth of the post-disaster economy. Therefore, according to the local characteristics of natural environment and economic system, the disaster-stricken areas need to actively change and readjust their economic structures. At the same time, attention should be paid to updating the production system to enhance the level of technological progress and give full play to the scale effects of large-scale capital, new facilities, human resources, and other investment factors following the disaster so as to enhance the impact of economic resilience and recovery efficiency in response to the disaster.

    1 Introduction

    The border areas of the Tibetan Plateau and the adjacent mountainous areas have a high incidence of earthquakes of magnitude greater than Ms 5.0, and also experience a dense distribution of geological disasters such as collapses, landslides, and debris flows (Cui and Jia, 2015). In recent years, due to the combined effects of climate change, geological tectonic movements, and intensive human activities, natural disasters have occurred frequently in the border areas of the Tibetan Plateau. Prevention of and responses to natural disasters have become major overriding issues for the preservation of homeland security, social stability, economic development, and people's livelihoods (Chen et al., 2013; IPCC, 2013; Qin et al., 2015). Since 2008, several massive natural disasters, including the Wenchuan Ms 8.0 Earthquake, the Yushu Ms 7.1 Earthquake, the Zhouqu Massive Mudslide, the Lushan Ms 7.0 Earthquake and the Ludian Ms 6.5 Earthquake, have all shown that the impact of natural disasters has further aggravated the dichotomy of preserving the natural environment and providing land for people to earn an economic living in the border areas of the Tibetan Plateau (Shi et al., 2017). In addition, the vulnerability of the human population and the economy continues to increase. Hence, in order to improve central and regional governments' ability to either prevent or respond to natural disasters, it is not only necessary to gain a deep and comprehensive understanding of the mechanisms responsible for natural disasters and the risks posed by natural systems (Fan et al., 2009; Zhou et al., 2017) but also to fully analyze the changes in and mechanism of post-disaster economic systems and to accurately grasp the status of post-disaster economic development and its recovery process. Moreover, in relation to the border areas of the Tibetan Plateau, it is necessary to scientifically formulate regulatory policies and measures for economic recovery according to the economic resilience of the region (Dacy and Kunreuther, 1969; Skidmore and Toya, 2002).

    At present, much research has been done in the area of post-disaster economic recovery. Most researchers have analyzed post-disaster economic shock and the recovery process by comparing the index changes before and after a disaster with the input-output coefficient, economic aggregate, economic growth rate, industrial structure, resident income, and the number of enterprises. The existing theoretical exploration of and empirical research on post-disaster economic recovery includes two main components.

    (1) The methods of post-disaster economic loss assessment are first applied to the direct and indirect economic loss assessment of natural disasters such as earthquakes and severe meteorological events, e.g., transforming the traditional input-output coefficient into the productivity loss coefficient to reflect the economic impact (Chang and Rose, 2012), using the social accounting matrix (SAM) model to study the post-disaster economic impact of earthquakes on islands (Song et al., 2016), putting forward improvements in the regional input-output model (ARIO) to measure the economic losses resulting from Hurricane Katrina and the economic effects on the state of Louisiana, USA (Steenge and Bockarjova, 2007), adopting the input-output model to evaluate the economic impact of the Wenchuan Earthquake on the disaster area, Sichuan Province, and even on the whole country (Cole et al., 1993; Ding et al., 2010; Hallegatte, 2010; Zhu, 2013).

    (2) With the concept of economic resilience, the econometric model and index system are used to evaluate the resilience of the post-disaster economy on the basis of discussing the growth model of the regional economy following the disaster (Zheng, 2008; Simmie and Martin, 2010; Rose and Krausmann, 2013). Moreover, effective strategies for improving the resilience of the post-disaster economy have been studied to reveal the long-term evolution trajectory of the economy in the disaster area (Rose and Lim, 2002; Rose and Liao, 2005; Lu and Dudensing, 2015). In addition, through empirical analysis of Hurricane Katrina in the USA in 2005 (Baade, 2007; Wu et al., 2013, the Wenchuan Earthquake in 2008 (Wu et al., 2013; Wu et al., 2014), and the Great East Japan Earthquake and Tsunami in 2011 (Leelawat et al., 2015), the differences in post-disaster economic recovery of different types of industries and different regional development conditions are discussed. In general, significant progress has been made in understanding post-disaster economic loss assessment and short-term impacts, post-disaster economic resilience and evolutionary characteristics, as well as industry and regional differences in post-disaster economic recovery.

    Existing studies, however, have paid more attention to the damaged state of the economy in the short term following a disaster, and there is a lack of quantitative analysis of the long-term economic recovery process and economic resilience. Research on the economic recovery effect and efficiency following natural disasters is also lacking. In addition, it is difficult to fully reflect the regional characteristics and influence of economic resilience and recovery efficiency by studying the economic recovery process in disaster areas as a whole. Consequently, this paper defines post-disaster economic resilience as the ability of the economic system in the disaster area to withstand and defuse the impact of earthquake disasters, which is characterized by both static and dynamic states. The static state emphasizes the robustness of the economic system during the earthquake impacts, while the dynamic state focuses on the rapidity and readability of long-term recovery from the impacts. Taking the areas most severely affected by the Wenchuan Earthquake as an example, according to the socioeconomic data of 10 disaster-hit counties and the post-disaster economic prediction results based on the differential autoregressive integrated moving average (ARIMA) model, the index of economic resilience of the border areas of the Tibetan Plateau impacted by the Wenchuan Earthquake was calculated. Then, an improved variable returns to scale (VRS) date envelopment analysis (DEA) model and the Malmquist productivity index were used to analyze the short-term and long-term economic recovery efficiency and its influence. This lays a scientific foundation for the assessment of post-disaster economic risks and the improvement in economic resilience in disaster-hit areas, as well as providing refined decision-making suggestions for the enhancement of natural disaster prevention and system response capabilities in the border areas of the Tibetan Plateau.

    2 Research methods and data sources

    2.1 Case study area and data sources

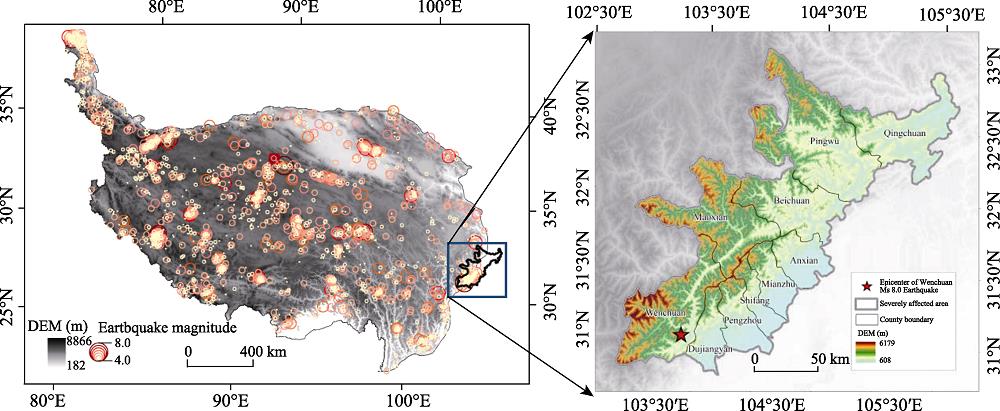
    According to the assessment results for the scope of the disaster following the Ms 8.0 Wenchuan Earthquake on May 12, 2008 (Tang et al., 2014), 10 counties (cities) belonging to the most severely affected areas were selected for this study. The areas most severely affected by the Wenchuan Earthquake are located on the eastern border of the Tibetan Plateau and include the Longmen mountain area and the piedmont transitional zone (Figure 1), including Wenchuan County, Maoxian County, Beichuan County, Qingchuan County, and Pingwu County in the plateau and mountain area and Mianzhu City, Shifang City, Sujiangyan City, Pengzhou City, and Anxian County in the plain and hilly area. With a total land area of 26,400 km2, these counties (cities) were those areas experiencing the most severe impacts during and following the disaster, and are the areas most severely affected by geological disasters in general. 57,300 people were killed by the earthquake directly, with 1.56% of the total population in the region, accounting for 82.86% of the total death toll in the earthquake. In 2007, before the earthquake, the total population of the severely affected areas was 3.6807 million, accounting for 4.53% of Sichuan's total population, and the urbanization rate was 23.19%. The gross domestic product (GDP) of the region was 60.583 billion yuan, accounting for 5.94% of the total GDP of the province. The ratios of primary industry, secondary industry and tertiary industry were 17.27:53.7:29.03, and the per capita GDP was 13,160 yuan, slightly higher than the provincial average (12,963 yuan).

    Location of the study area in the border areas of the Tibetan Plateau and map of its topography (expanded inset on the right)

    Figure 1.Location of the study area in the border areas of the Tibetan Plateau and map of its topography (expanded inset on the right)

    In terms of data collection and processing, taking the counties (cities) as the basic unit and 1994, the starting year with complete statistical data, as the base period, the constant prices of GDP, per capita GDP, the output values of the three strata of industry were converted by indices of GDP, the relative numbers reflecting the trend and degree of GDP change compared with the previous year at comparable prices. Since the capital stock data for the severely affected areas could not be directly obtained, in this paper the capital investment index of Sichuan Province was adopted to deflate the price of the total social fixed assets investment in the severely affected areas, and then the international perpetual inventory method was adopted to convert the flow of fixed assets into capital stock. The capital stock data calculated by the existing estimation methods were used as the base period capital stock, and the depreciation rate was set at a constant rate of 9.6% (Wu et al., 2014; SC, 2008). The data come mainly from the statistical yearbook of Sichuan Province for the period 1995 to 2016. For those research units whose statistical data were incomplete, the statistical yearbook of the units at the local level was adopted.

    2.2 Research methods

    2.2.1 ARIMA prediction model

    The ARIMA model, whose principle function is to transform a nonstationary time series into a stationary one and then carry out a regression analysis of each lag period of the dependent variable, the present value of the random error term, and each lag period of the random error term (Wu et al., 2014). The model analyzes the trend of changes in the time series by predicting the time series of the target itself, with the error generated by the model and the present value as a factor. The ARIMA model has the characteristics of great flexibility and easy adaptation to external changes, and is widely used for national and regional economic predictions (Zhang et al., 2004; 2009). The model is described by Eq. (1):

    ${{Y}_{t}}=c+{{\alpha }_{1}}{{Y}_{t-1}}+{{\alpha }_{2}}{{Y}_{t-2}}+\cdots +{{\alpha }_{p}}{{Y}_{t-p}}+\varepsilon {{\alpha }_{t}}+{{\beta }_{1}}{{\varepsilon }_{t-1}}+{{\beta }_{2}}{{\varepsilon }_{t-2}}+\cdots +{{\beta }_{q}}{{\varepsilon }_{t-q}}$

    where c is a constant, εt is a white noise process, and αi and βi are the regression coefficients. After the model transforms the nonstationary time series into a stationary time series through d-order difference, the values of p and q are obtained by order determination and parameter estimation, and then the time series is predicted by the ARIMA (p,d,q) model. The main steps include: (1) testing the stability of the historical economic data sequence in the disaster area; if the original sequence is nonstationary, then a difference transformation or logarithmic difference transformation is carried out to generate the stationary sequence; (2) the characteristic statistics of the sequences are described in terms of the autocorrelation coefficient and the partial autocorrelation coefficient, and then the orders p and q of the model are determined; (3) the model parameters are estimated, and a significance test and a rationality test of the model are carried out using the parameter t statistic; and (4) the model is diagnosed by whether the residual term of the model is white noise. If it passes the white noise test, the model is used for post-disaster economic prediction.

    2.2.2 Measurement model of post-disaster economic resilience

    Based on the growth trajectory and a model of the regional economy following external shock events, Simmie and Martin (2010) developed a measurement model of post-disaster economic resilience. The temporal variation in the regional economy following a disaster is shown in Figure 2, where t1 is the time point when the earthquake occurred; y° = f°(x) is the assumed growth trajectory extrapolated from the long-term (t0 - t1) trend without being impacted by the disaster; and y = f(x) is the actual growth trajectory after being impacted. Then, ΔS represents the difference between the actual growth and the assumed growth, reflecting the degree of economic loss following the disaster, the area S represents the actual growth following the impact, and the post-disaster economic resilience index (R) is defined as follows:

    $R=S/(S+\Delta S)=\underset{{{t}_{2}}}{\overset{{{t}_{1}}}{\mathop \int }}\,f(t)dt/\underset{{{t}_{2}}}{\overset{{{t}_{1}}}{\mathop \int }}\,{f}'(t)dt$

    where the time period of t1 - t2 is from 2007 to 2015. The expression y° = f°(x) is obtained by fitting a polynomial based on the economic scale predicted by the ARIMA model. Generally, the higher the value of R, the higher the economic resilience of the disaster area; otherwise, the lower the economic resilience. If R = 1, there is no significant influence on the region, and the economy maintains its original growth rate after the disaster. If R > 1, there is a positive impact on the region, the post-disaster economy can achieve leapfrog development through self-adjustment, and the impact of the disaster becomes an opportunity to adjust the trajectory of economic development. The larger the difference between R and 1, the deeper the negative impact of the disaster. The economy experiences negative growth in the short term following the disaster, and it is difficult for the long-term growth rate to recover to the pre-disaster level.

    Schematic diagram of the growth trajectory of the post-disaster regional economy

    Figure 2.Schematic diagram of the growth trajectory of the post-disaster regional economy

    2.2.3 Improved DEA model with VRS

    The DEA model with VRS was selected to evaluate the relative efficiency of economic recovery in the short term following the earthquake. Taking a severely affected county (city) as the decision-making unit (DMU), the number of units is N = 10. There are I types of input, O types of output, and xni represents the type I economic input of the Nth quake-hit county, and yno represents the type O economic output of the Nth quake-hit county (Banker et al., 1984; Baade, 2007; Nishimura et al., 2013). The DEA model is described by Eq. (3):

    $\begin{cases} \min \left( \theta -\varepsilon \left( \underset{I=1}{\overset{I}{\mathop \sum }}\,{{s}^{-}}-\underset{O=1}{\overset{O}{\mathop \sum }}\,{{s}^{+}} \right) \right) \\ s.t.\underset{n=1}{\overset{N}{\mathop \sum }}\,{{x}_{ni}}{{\lambda }_{n}}+{{s}^{-}}=\theta x_{i}^{n}\ \ \ \ \ \ \ \ \ \ \ i=1,2\ldots I \\ \underset{n=1}{\overset{N}{\mathop \sum }}\,{{y}_{no}}{{\lambda }_{n}}-{{s}^{+}}=y_{o}^{n}~~~~~~~~~~~~~~~~~~o=1,2\ldots O \\ {{\lambda }_{n}}\ge 0\ \ \ \ \ \ \ \ \ \ \ \ \ \ \ \ \ \ \ \ \ \ \ \ \ \ \ \ \ \ \ n=1,2\ldots N \\ \end{cases}$.

    Based on the DEA model of constant returns to scale (CRS), the VRS model was established by introducing the constraints:$\underset{n=1}{\overset{N}{\mathop \sum }}\,=1$, where θ (0<θ≤1) represents the comprehensive index of economic recovery efficiency. The higher the value of θ, the higher the comprehensive efficiency of economic recovery. A value of θ = 1 shows that the DMU operates on the optimal production front, and its output reaches the optimal comprehensive efficiency relative to the input. The variable ε is the non-Archimedes infinitesimal quantity; λn (λn≥ 0) is the weight variable to judge the scale return of the DMU; s- (s-≥ 0) is the relaxation variable, which represents the input amount that needs to be reduced to achieve DEA effectiveness; and s+ (s+≥ 0) is the remaining variable, which represents the increased output needed to achieve DEA effectiveness. The comprehensive efficiency θn can be decomposed into the product of pure technical efficiency θTE and scale efficiency θSE by using the VRS model. The closer the values of θTE and θSE are to 1, the higher the pure technical efficiency and scale efficiency will be.

    2.2.4 Malmquist productivity index model

    In order to further understand the interannual variation in the long-term economic recovery efficiency in disaster areas, the Malmquist productivity index model was adopted. The total factor productivity was decomposed into changes in technological progress, pure technical efficiency, and scale efficiency. Färe et al. (1997) constructed the Malmquist productivity index formula for the period t to t + 1 with constant scale efficiency (Charnes et al., 1994). The formula is given by Eq. (4):

    $M({{x}^{t+1}},{{y}^{t+1}},{x}',{y}')=\sqrt{\frac{{D}'({{x}^{t+1}},{{y}^{t+1}})}{{D}'({x}',{y}')}\times \frac{{{D}^{t+1}}({{x}^{t+1}},{{y}^{t+1}})}{{{D}^{t+1}}({x}',{y}')}}$

    where ${D}'({x}',{y}')$ and ${D}'({{x}^{t+1}},{{y}^{t+1}})$ refer to the distance function of the DMU in period t and period t + 1 when the technology in period t is taken as a reference. Under the hypothesis of VRS, the Malmquist productivity index can be decomposed into two parts: the comprehensive efficiency (effch) and the technological rate of change (techch). The variable effch can be further decomposed into pure technical efficiency (pech) and scale efficiency (sech) (Färe et al., 1997; Li et al., 2005). The formula can be decomposed as given by Eq. (5):

    $\begin{align} & M({{x}^{t+1}},{{y}^{t+1}},{x}',{y}')=\frac{{{D}^{t+1}}({{x}^{t+1}},{{y}^{t+1}}\text{ }\!\!|\!\!\text{ }VRS)}{{{D}^{t}}({{x}^{t}},{{y}^{t}}\text{ }\!\!|\!\!\text{ }VRS)}\times \frac{{{D}^{t+1}}({{x}^{t+1}},{{y}^{t+1}}\text{ }\!\!|\!\!\text{ }CRS)}{{{D}^{t+1}}({{x}^{t+1}},{{y}^{t+1}}\text{ }\!\!|\!\!\text{ }VRS)}\times \\ & \ \ \ \frac{{{D}^{t}}({{x}^{t}},{{y}^{t}}\text{ }\!\!|\!\!\text{ }VRS)}{{{D}^{t}}({{x}^{t}},{{y}^{t}}\text{ }\!\!|\!\!\text{ }CRS)}\times \sqrt{\frac{{{D}^{t}}({{x}^{t+1}},{{y}^{t+1}})}{{{D}^{t+1}}({{x}^{t+1}},{{y}^{t+1}})}\times \frac{{{D}^{t}}({{x}^{t}},{{y}^{t}})}{{{D}^{t+1}}({{x}^{t}},{{y}^{t}})}} \\ & \ \ \ =pech\times sech\times techch \\ \end{align}$

    When the Malmquist productivity index is greater than 1, the total factor level in the t - t + 1 period increases, and vice versa. Techch reflects the extent to which the movement of the production front contributes to the change in productivity; effch reflects the ability of the DMU to obtain the maximum output given the input; pech reflects the change in technical efficiency under the VRS assumption; and sech reflects the impact of economies of scale on productivity.

    3 Results

    3.1 Post-disaster economic resilience

    3.1.1 Economic recovery cycle

    Before the Wenchuan Earthquake, the 10 counties and cities in the most severely affected areas had maintained an average annual growth rate of more than 10%. Following the 2008 earthquake, the total GDP decreased from 52.787 billion yuan in 2007 to 38.546 billion yuan, a decrease of 26.98%. Of the 10 counties, Wenchuan County, where the epicenter was located, had the highest degree of recession (Figure 3), with a decline in GDP of 56.01%. Maoxian County, Dujiangyan City, Mianzhu City, and Shifang City all experienced a degree of recession of more than one third. Pengzhou City and Anxian County in the plain region suffered from a lower degree of recession, with a lowering in GDP of 12.90% and 6.30%, respectively, following the earthquake. From the perspective of the recovery cycle (that is, the time to recover to the level of the economy in the years before the earthquake), it took two years for the economies in the most severely affected areas to recover to their pre-earthquake levels. From the perspective of post-earthquake GDP changes in the 10 counties, all of the counties and cities recovered to their pre-earthquake levels within three years. Their recovery cycles varied according to the severity of the disaster they experienced and the natural factors such as the geographical position and topographical features. The recovery cycle lasted one year in plain area, two years in Beichuan County, Qingchuan County, Pingwu County, and Maoxian County on the western Sichuan Plateau, and three years in Wenchuan County, Mianzhu City, Shifang City, and Dujiangyan City, which are close to where the epicenter was located.

    Comparison of pre-earthquake and post-earthquake GDP

    Figure 3.Comparison of pre-earthquake and post-earthquake GDP

    3.1.2 Overall and sectoral economic resilience

    Based on the value-added data for the three strata of industry from 1994 to 2007, the ARIMA model was adopted to predict the GDP and growth trajectory of these three strata under the condition of no earthquake (Figure 4) and to compare them with the actual GDP data to calculate the economic resilience index according to Eq. (2). The results show that the economic resilience index of GDP post-Wenchuan Earthquake was 0.877, indicating that the economic resilience of the most severely affected areas was relatively high, while those of the primary, secondary, and tertiary industries were 0.903, 0.781, and 1.07, respectively. The economic resilience of the different industrial strata post-disaster were significantly different, and the economic resilience of agriculture and the service industry were higher than that of manufacturing industry. It further shows that the added value of secondary industry in the quake-hit areas dropped from 28.346 billion yuan in 2007, before the earthquake, to 19.481 billion yuan in 2008, a decrease of 31.28%. Following the earthquake, the recovery cycle of the industrial economy was three years, which was longer than that of agriculture and the service industry, especially in the Dujiangyan-Shifang-Mianzhu area where large industrial enterprises are concentrated, as well as in Wenchuan and Maoxian counties, which suffered heavy losses from landslides and landfill. According to the survey, in Shifang, the city with the largest economy in the most severely affected areas, the pillar industries of the phosphorus chemical industry and the cement industry experienced loss ratios of 90% and 70%, respectively.

    Changes in GDP and added value of the three strata of industry

    Figure 4.Changes in GDP and added value of the three strata of industry

    As shown in Figure 4, the added value of primary industry in the most severely affected areas decreased by 9.86% in 2008 compared with that before the earthquake, and the earthquake had only a certain impact in that year. Since 2009, the growth rate of primary industry increased slightly compared with that before the earthquake, and the curves for predicted value and actual value basically coincide. Following the earthquake, the service industry recovered strongly and rapidly. The added value of tertiary industry dropped from 15.322 billion yuan before the earthquake to 10.861 billion yuan in the year following the earthquake. However, in the subsequent five years, the growth rates of added value of tertiary industry were 36.73%, 18.42%, 10.28%, 13.51%, and 12.76%, respectively, with an average annual growth rate of 18.34%, which is nearly twice the average growth rate of the five years before the earthquake. Figure 4 also shows that the curve for the actual value of tertiary industry has been higher than that for predicted value since 2011. The recovery cycles of industries in all counties also show that the post-earthquake industrial recovery cycle was generally longer than that of the service industry (Figure 5). For example, the recovery cycle of secondary industry in Wenchuan County, the epicenter, was four years, while that of tertiary industry was only one year. In addition, the recovery cycle coupling between industry and the overall economy was relatively high, indicating that the earthquake not only damaged the industrial equipment but also impacted the overall production system. The economic resilience of the industrial sector is the bottleneck that determines economic recovery in the disaster area.

    Differences in the recovery cycles between secondary industry and tertiary industry

    Figure 5.Differences in the recovery cycles between secondary industry and tertiary industry

    3.1.3 Economic readjustment process

    A comparison of the model predictions for the post-earthquake economy indicates that the post-earthquake economy was able to undergo structural readjustment and was relatively resilient to the crisis (Figure 6). Five years before the earthquake, the proportion of agriculture and service industries in the economy decreased, and the proportion of manufacturing industries increased. Industrial and agricultural growth slowed after the quake, falling 3.25 and 2.46 percentage points, respectively, on average in the five years following the quake compared with the five years before. The growth rate of the service sector was 8.82 percentage points higher than in the five years before the earthquake, and by 2015 the proportion of the service sector in the most severely affected areas had risen to 32%. In Wenchuan, Beichuan, and Mianzhu, in particular, the economic development model is gradually shifting toward a co-driven transformation of industry and services. By analyzing the contribution of the three industrial strata (i.e., [increment of the three strata of industry/increment of GDP]× 100%), it was found that the contributions of the three strata of industry to economic growth in the disaster-stricken areas were 9.65%, 70.02%, and 20.33%, respectively. However, the actual contributions of the three strata were 7.78%, 55.29%, and 36.99%, respectively, and the service industry played a significant role in boosting the regional economy following the disaster. In addition to receiving funds for emergency relief and post-disaster relief, the most severely affected counties have also received considerable funds from central government for recovery and reconstruction, domestic and foreign counterpart assistance, and for construction assistance. Moreover, financial support policies, such as post-disaster tax incentives and loans, have stimulated new investment opportunities in industries in the region, especially in the service sector in the most severely affected areas, so as to accelerate the process of post-earthquake economic transformation.

    Changes in the industrial structure of the three strata of industry

    Figure 6.Changes in the industrial structure of the three strata of industry

    At the same time, the post-earthquake economic transformation has significantly boosted the level of economic development in the most severely affected areas. In the three years following 2009, the per capita GDP growth rates in the disaster areas were 22.28%, 20.05%, and 19.29%, respectively. By 2010, the levels of per capita GDP in the most severely affected areas had recovered to the absolute levels in the year before the earthquake, and by 2015, it had doubled compared with that before the earthquake. Moreover, post-earthquake development opportunities and industrial restructuring have narrowed the gaps between the different levels of economic development of the different counties. From the coefficient of variation (CV value) of per capita GDP over the years, it was found that the trend for widening of the economic gaps between the post-earthquake disaster areas has been reversed. The CV value remained above 0.7 in the five years before the earthquake, but decreased to 0.65 in the five years following the earthquake (Figure 7), and remained stable for several years thereafter.

    Changes in per capita GDP and coefficient of variation

    Figure 7.Changes in per capita GDP and coefficient of variation

    3.2 Efficiency of post-disaster economic recovery

    To measure the efficiency of post-disaster economic recovery from the perspective of input and output, it should be pointed out that when the DEA model is used for evaluation, it is generally stipulated that the sum of input and output indicators is less than or equal to one-third (⅓) of the number of evaluation units (Färe et al., 1997). Hence, the measure of the 10 most severely affected counties requires, at most, three input-output indicators. Therefore, three main indicators were selected according to the change characteristics of post-disaster economic input and output factors, which were in line with the empirical rule used by DEA. From the perspective of investment in economic recovery, the number of employees (10,000 people) and the capital stock estimated by the sustainable inventory method (10,000 yuan) were selected to represent the post-disaster human factors and the capital factors input, respectively, while GDP (10,000 yuan) was selected from the output perspective to represent the post-disaster economic output.

    3.2.1 Short-term economic recovery efficiency based on the VRS model

    Based on the input and output indicators of the most severely affected areas in 2008, the VRS model was adopted for evaluation, and the results are shown in Table 1. Following the earthquake, the relative efficiency of economic recovery in each county in a short period showed the characteristics described below.

    AreaComprehensive efficiencyPure technical efficiencyScale efficiencyReturns to scale
    Wenchuan0.5051.0000.505Increase
    Beichuan0.2931.0000.293Increase
    Mianzhu1.0001.0001.000Constant
    Shifang1.0001.0001.000Constant
    Qingchuan0.3211.0000.321Increase
    Maoxian0.2691.0000.269Increase
    Dujiangyan0.9120.9390.971Decrease
    Pingwu0.2990.5800.515Increase
    Pengzhou0.6371.0000.637Decrease
    Anxian0.7980.9810.813Increase
    Average value0.6030.9500.632

    Table 1.

    Relative efficiency of economic recovery and its decomposition results for 2008

    The comprehensive efficiency of economic recovery in the most severely affected areas in 2008 was 0.603, which was only 60.3% of the optimal level. Only two cities in the most severely affected areas, Mianzhu City and Shifang City, achieved DEA effectiveness, and both the technology efficiency and the scale efficiency were 100% of the optimal level, indicating that the economic input factors were reasonably combined and allocated and that the post-earthquake economic recovery efficiency was at a relatively advanced level in the most severely affected areas. The other eight counties and cities did not achieve DEA effectiveness, and their economic input has not been fully utilized because of the disaster. According to the decomposition of pure technical efficiency and scale efficiency, the pure technical efficiency of economic recovery in the most severely affected areas was 0.950, 95.0% of the optimal level. Six counties and cities, including Mianzhu, Shifang, Pengzhou, Wenchuan, Maoxian, and Beichuan, achieved technical efficiency, while the other four counties and cities were in an inefficient state of pure technical efficiency. The scale efficiency of economic recovery in the most severely affected areas was 0.632, 63.2% of the optimal level. Of these areas, only Mianzhu and Shifang were effective in scale efficiency, and remained unchanged, while the other counties and cities were ineffective in scale efficiency, and mainly increased in scale efficiency.

    The comprehensive efficiency, pure technical efficiency, and scale efficiency of short-term economic recovery in the plain and hilly areas were significantly higher than those in the plateau and mountain areas. The average values for the former areas were 0.869, 0.984, and 0.884 respectively, while those for the latter areas were 0.337, 0.916, and 0.381 respectively. This indicates that the strong earthquake had an impact on the production efficiency affected by management, technology, and input scale factors in the plateau and mountain areas, which led to weak economic resilience in the short term following the earthquake. Among the counties, the comprehensive efficiencies of Beichuan, Qingchuan, Maoxian, and Pingwu counties were less than 40% of the optimal level. A correlation test was conducted of comprehensive efficiency index, per capita GDP, and industrialization level. The results show that there was a significant positive correlation between per capita GDP, industrialization level, and economic recovery efficiency (confidence level was 0.05). The Pearson correlation coefficients were 0.884 and 0.537, respectively, indicating that regions with higher levels of economic development and industrialization had greater economic resilience, while poor counties were less resilient to earthquake disasters.

    3.2.2 Medium- and long-term economic recovery efficiency based on the Malmquist TFP

    The Malmquist total factor productivity (TFP) index of post-disaster economic recovery from 2000 to 2015, along with its decomposition results, were calculated using DEAP2.1 software. The interannual trend of TFP (Figure 8) shows that it was stable for a long period of time before the earthquake, and the TFP index basically maintained growth within 1.5%. In terms of the components of the change in the TFP index, the main source of growth was technological progress. The average value of the TFP index from 2000 to 2007 was 1.104, with an average annual growth rate of 10.4%. Compared with the pre-earthquake TFP, the post-earthquake TFP was significantly different, showing the following cases of economic recovery efficiency.

    Changes in total factor productivity (TFP) and its decomposition results

    Figure 8.Changes in total factor productivity (TFP) and its decomposition results

    (1) In the two years following the earthquake, the TFP fluctuated considerably, and the economic recovery efficiency decreased significantly, resulting in short-term economic recession.

    In the two years following the earthquake, the TFP index values in the most severely affected areas were 0.663 and 0.848, respectively, and TFP declined by 33.7% and 15.2%, respectively. In the five years since 2010, TFP in the most severely affected areas rebounded and returned to a steady state. The TFP index values were 1.041, 1.015, 1.032, 1.03, and 1.036, respectively, maintaining an average annual growth rate of 3%. In general, the Wenchuan Earthquake caused severe fluctuations in TFP in the most severely affected areas, and the significant decline in economic output efficiency following the earthquake resulted in a short-term economic recession. However, following the two-year recession, the most severely affected areas gradually shifted from high-speed rebound to stable growth.

    (2) The rate of technical change was strongly affected by the earthquake, and the renewal of the production system was the leading factor in determining economic recovery following the earthquake.

    From the TFP decomposition results (Table 2), the economic recovery efficiency in the most severely affected areas was affected mainly by technological changes, and the speed of those changes directly affected the growth rate of TFP. Similar to the Malmquist index, the technical change index values in the most severely affected areas decreased significantly, to 0.646 and 0.886, respectively, in the two years following the earthquake, and increased by 24.0% and 14.4%, respectively, in the following two years. Technological progress has been the main driving force behind the post-earthquake recovery of the TFP index, which shows that the disaster destroyed the old technology and production system in the most severely affected areas, and, after a short period of economic downturn and recovery, the replacement of damaged equipment and the establishment of a new production system improved labor productivity in the disaster areas, such that the regional economic growth rate continued to rise. This is consistent with the research conclusions of Hallegatte and Dumas (2015) and of Skidmore and Martin (2010) on the consequences of natural disasters. The Wenchuan Earthquake has also become a catalyst for reinvestment and technology upgrading in the most severely affected areas, which, in turn, has promoted the recovery of economic system functions and scale improvements in those areas.

    YearComprehensive efficiencyRate of technological changePure technical efficiencyScale efficiencyTotal factor growth rate
    20070.9241.1310.9740.9481.044
    20081.0270.6461.0530.9750.663
    20090.9570.8860.8541.1210.848
    20101.0111.0300.9881.0231.041
    20110.9301.0921.0120.9191.015
    20120.9931.0391.0600.9371.032
    20131.0191.0111.0690.9531.030
    20141.0370.9991.0291.0071.036
    20151.0370.9770.9911.0471.014

    Table 2.

    Malmquist index and its decomposition results since 2007

    (3) Following the earthquake, the comprehensive economic efficiency improved steadily, and the pure technical efficiency and scale efficiency improved alternately.

    The comprehensive efficiency did not show the same strong fluctuations as TFP and the technology change index. In 2008 and 2009, the values of the index of comprehensive efficiency change for the most severely affected areas were 1.027 and 0.957, respectively, which then maintained a stable increasing trend of less than 1% annually. It is worth noting that with the progress of recovery time, the improvement in comprehensive efficiency has pulled on TFP, which was an important driving force for long-term economic recovery and development following the earthquake. Then, the comprehensive efficiency was decomposed into pure technical efficiency and scale efficiency under VRS. As shown in Table 2, the values of pure technical efficiency were 0.854 and 0.988 in 2008 and 2009, and then increased at 4.25% since 2010, while the scale efficiencies were 1.121 and 1.023 in the two years following the earthquake, and then maintained a growth rate of 6.37%. The alternating improvement trends of pure technical efficiency and scale efficiency show that the comprehensive efficiency of economic recovery in the short term following the earthquake depends mainly on the improvement in scale efficiency; however, with the decline in scale gains in the post-disaster economic recovery, the economic recovery in disaster areas depends mainly on pure technical efficiency, which is the driving force for maintaining long-term economic growth following the disaster.

    (4) Following the earthquake, the economic efficiency of the plateau and mountain areas decreased significantly, and resilience was lower in those areas than in the plain and hilly areas in the short term.

    According to the post-earthquake changes in different regions, in 2008 the Malmquist index values of the plateau and mountain areas and the plain and hilly areas were 0.598 and 0.747, respectively, that is, decreases of 40.18% and 25.26%, respectively, compared with 2007. The results show that the economic efficiency of plateau and mountain areas decreased significantly and their economic resilience was lower than that of the plain and hilly areas. Further analysis shows that following the earthquake, the technical change index values of the plateau and mountain areas and the plain and hilly areas decreased by 35.18% and 35.64%, respectively. However, due to the difference in the comprehensive economic efficiency, that is, the plain and hilly areas were significantly better (1.161) than the plateau and mountain areas (0.924) in terms of their comprehensive economic efficiency, resulting in the relatively high resilience of the plain and hilly areas in the short term. It can be seen that when post-earthquake technology and production systems are severely damaged, the plain and hilly areas have obvious advantages in terms of economic management, resource allocation, and other aspects. Therefore, the economic efficiency of those areas is higher than that of the plateau and mountain areas, which can have technical benefits and economies of scale in the short term, and the total factor growth rate can increase rapidly as a result.

    4 Conclusions and implications

    Based on the predictions of the ARIMA model, this paper has calculated the index of economic resilience in the most severely affected areas following the Wenchuan Earthquake of 2008, and has revealed the robustness, rapidity, and adaptability of economic recovery in the border areas of the Tibetan Plateau following the disaster. In addition, using the VRS model and the Malmquist productivity index evaluation, the short-term and long-term economic recovery efficiencies and impact effects have been analyzed. The four main conclusions and policy implications are described below.

    (1) The economy in the areas most severely affected by the Wenchuan Earthquake is relatively resilient. The earthquake led to a short-term economic recession, but the economy recovered to the pre-earthquake level within two years. The economic resilience indexes of GDP and the three strata of industry were 0.877, 0.903, 0.781, and 1.07, respectively, among which the economic resilience index values for agriculture and the service industry were higher than that of manufacturing industry. The economy of the region showed a certain resilience following the quake. The capital, human resources, and material inputs for construction assistance have stimulated the structural readjustment of industries in the most severely affected areas, have brought about a significant boost to regional economic development, and have narrowed the gap in the level of economic development within the most severely affected areas. By 2010, per capita GDP had recovered to the pre-earthquake level, and by 2015 it had basically doubled from that before the earthquake. The coefficient of variation of per capita GDP in the most severely affected areas also decreased, from above 0.7 in the five years before the quake to 0.65 in the five years following the quake.

    (2) In 2008, the comprehensive efficiency of economic recovery in the disaster areas was only 60.3% of the optimal level. The comprehensive efficiency, pure technical efficiency, and scale efficiency of short-term economic recovery in the plain and hilly areas were significantly higher than those in the plateau and mountain areas. The powerful earthquake had an impact on production efficiency, and was affected by factors such as management and technology, as well as by factors of input scale, resulting in weak economic resilience in the short term following the earthquake. From the perspective of interannual changes, TFP fluctuated strongly following the earthquake. The TFP index in the disaster areas decreased by 33.7% and 15.2%, respectively, in 2009 and 2010, and then maintained an average annual growth rate of 3%. The significant decline in the post-earthquake TFP index is due mainly to technological changes, and the updating of the production system was the leading factor in determining post-earthquake economic resilience, which is also the important reason why the post-earthquake economic resilience of the plateau and mountain areas was weaker than that of the plain and hilly areas. It was also found that, with the decline in economic scale, long-term economic recovery in the disaster areas depends mainly on pure technical efficiency.

    (3) The study shows that although government financial input and external counterpart assistance, including emergency and transitional assistance, are the keys to the rapid recovery of the post-disaster economic order in the border areas of the Tibetan Plateau, it is endogenous technological progress that plays the decisive role in the resilience and recovery efficiency of the post-disaster economy. To achieve a better recovery effect, on the one hand, the difference between natural conditions and the stage of economic development should be taken into account. The disaster areas themselves need to actively adjust and reform the economic structure. On the other hand, regarding top-down support and government financial assistance, it is necessary to pay attention to the upgrading of the production system in the disaster areas to improve the level of technological progress. Only in this way can the scale effect of large-scale capital, new facilities, human resources, and other inputs be exerted in order to enhance the economic resilience and recovery efficiency in responding to the impact of natural disasters. Therefore, the enlightened policies that would enhance the resilience of the post-disaster economy can be summarized as follows: (i) full play should be given to the initiative of self-reliance of people who live in the disaster areas, enhance the self-development capacity of economic recovery in the long run, and take the post-disaster economic recovery as an opportunity to optimize the industrial structure and adjust the industrial layout. Guided by the market, and based on the carrying capacity of resources and the environment, industrial policies, and employment needs, scientific guidance should be given to disaster-hit enterprises to rebuild, relocate, close down, or turn around and support the recovery and development of industries with distinctive strengths; (ii) while restoring the hardware systems in areas of urban and rural housing, infrastructure, and public service facilities, a focus should also be maintained on the re-engineering of software systems such as skills training, employment assistance, investment attraction, and park operation and management. Through the co-construction of industrial parks, work-for-relief, industrial cooperation projects, and other forms of industrial counterpart assistance and cooperation, the ability of workers in disaster-hit areas to find new jobs and transfer jobs would be increased, thereby simultaneously improving the hardware- and software-supporting capabilities for post-disaster economic development; (iii) new ways should be developed to invest both government funds and market capital, a disaster prevention and reduction reserve fund, a special fund for post-disaster reconstruction, a counterpart support fund, a natural disaster risk investment fund, government bonds, disaster relief lottery, etc. should all be established. A government-led, multi-source investment and risk-sharing investment guarantee system and risk-sharing mechanism should be established to make society more resilient as a whole, and, particular, resilient to natural disasters.

    (4) This paper explores the post-earthquake economic recovery process and its efficiency in the border areas of the Tibetan Plateau. Limited by difficulties in obtaining data, however, only the total economic volume and the three strata of industry were selected for comparative analysis. In fact, the preliminary research conclusions of this paper have shown that there were significant differences in the recovery efficiency and change trends of different industries following the earthquake. Therefore, supported by large-scale funds, new facilities, human resources, and other assistance, more thorough studies of the post-disaster recovery process and differences in the input-output efficiency of various industries need to be undertaken. Moreover, this study also found that the degree of mixing of old and new capital affects economic recovery efficiency, and the share of old capital stock was significantly correlated with pure technical efficiency and scale efficiency (correlation coefficients of 0.643 and -0.695, respectively); thus, further study is of great practical importance for optimizing the investment mechanism of economic recovery funds. In addition, for the border areas of the Tibetan Plateau, it is particularly important to realize a balanced and coordinated development of the economy and ecological environment following natural disasters. Whether the choice of industrial development path in disaster areas is compatible with the carrying capacity of resources and the environment there is an important direction for future research.

    References

    [1] Estimating the economic impact of natural and social disasters, with an application to hurricane Katrina. Urban Studies, 44, 2061-2076(2007).

    [2] Some models for estimating technical and scale inefficiencies in data envelopment analysis. Management Science, 30, 1078-1092(1984).

    [3] Towards a theory of economic recovery from disasters. International Journal of Mass Emergencies & Disasters, 32, 171-181(2012).

    [4] et alData Envelopment Analysis: Theory, Methodology, and Applications. Netherlands:Springer.(1994).

    [5] et alFrom 2008 Wenchuan earthquake to 2013 Lushan earthquake. Scientia Sinica Terrae, 43, 1064-1072(2013).

    [6] Social accounting for disaster preparedness and recovery planning. Technical Report NCEER-93-0002, National Centre for Earthquake Engineering Research.(1993).

    [7] Mountain hazards in the Tibetan Plateau: Research status and prospects. National Science Review, 2, 397-399(2015).

    [8] . The Economics of Natural Disasters: Implications for Federal Policy, 43-63(1969).

    [9] A method based on input-output model to evaluate economic impact of disasters. Journal of Natural Disasters, 19, 113-118(2010).

    [10] et al. Planning of Post-Disaster Reconstruction of Wenchuan: Resources and Environmental Carrying Capacity Evaluation(2009).

    [11] Productivity growth, technical progress, and efficiency change in industrialized countries: Reply. American Economic Review, 87, 1040-1044(1997).

    [12] An adaptive regional input-output model and its application to the assessment of the economic cost of Katrina. Risk Analysis, 28, 779-799(2010).

    [13] Can natural disasters have positive consequences? Investigating the role of embodied technical change. Ecological Economics, 68, 777-786(2015).

    [14] . Climate Change 2013: The Physical Science Basis(2013).

    [15] Disaster recovery and reconstruction following the 2011 Great East Japan Earthquake and Tsunami: A business process management perspective. International Journal of Disaster Risk Science, 6, 310-314(2015).

    [16] Temporal and spatial changes of urban efficiency in the 1990s. Acta Geographica Sinica, 60, 615-625(2005).

    [17] Post-Ike economic resilience along the Texas coast. Disasters, 39, 493-521(2015).

    [18] Damage assessment in tourism caused by an earthquake disaster. Infrastructure Planning Review, 3, 56-74(2013).

    [19] et al. China’s Climate Extreme and Disaster Risk Management and Adapt to The National Assessment Report.(2015).

    [20] Resilience: an evolutionary approach to spatial economic systems. Networks and Spatial Economics, 2, 211-229(2002).

    [21] An economic framework for the development of a resilience index for business recovery. International Journal of Disaster Risk Reduction, 73-83(2013).

    [22] Modeling regional economic resilience to disasters: A computable general equilibrium analysis of water service disruptions. Journal of Regional Science, 45, 75-112(2005).

    [23] Business interruption losses from natural hazards: Conceptual and methodological issues in the case of the Northridge earthquake. Global Environmental Change Part B Environmental Hazards, 4, 1-14(2002).

    [24] et alResearch review and prospects of natural disasters regionalization in China. Geographical Research, 36, 1401-1414(2017).

    [25] The economic resilience of regions: Towards an evolutionary approach. Cambridge Journal of Regions, Economy and Society, 3, 27-43(2010).

    [26] Do natural disasters promote long-run growth?. Economic Inquiry, 40, 664-687(2002).

    [27] Post-natural disaster economic recovery: Recent progress. Journal of Beijing Normal University, 52, 196-201(2016).

    [28] Thinking about imbalances and rigidities in post-catastrophe economies: An input-output based proposition. Economic Systems Research, 19, 205-223(2007).

    [29] et alTheoretical and empirical study of the impact of Wenchuan earthquake on economic growth in Aba Prefecture. Journal of Natural Disasters, 23, 90-97(2014).

    [30] . Post-Wenchuan Earthquake recovery and reconstruction master plan.(2008). http://www.gov.cn/zhengce/content/2008-09/24/content_6121.htm

    [31] et alPost-disaster recovery and economic impact of catastrophes in China. Earthquake Spectra, 30, 1825-1846(2014).

    [32] et alCost-benefit analysis of China’s state-run natural disaster relief system: Methods and application. Journal of Beijing Normal University (Natural Science), 50, 100-104(2014).

    [33] et alDisaster recovery measurement framework: An application case of disaster recovery after hurricane Katrina. Journal of Natural Disasters, 22, 58-64(2013).

    [34] Structural reform and industrial growth in China. Economic Research Journal, 4-20(2009).

    [35] The estimation of China’s provincial capital stock: 1952-2000. Economic Research Journal, 35-44(2004).

    [36] The analysis of total factor productivity in China: A review and application of Malmquist index approach. Journal of Quantitative & Technical Economics, 25, 111-122(2008).

    [37] Analysis of the impact of Wenchuan earthquake on national and regional economic growth and countermeasures. Journal of Southwest Minzu University (Humanities & Social Sciences Edition), 29, 75-79(2008).

    [38] Paradigm and prospects of emergent evaluation of post-disaster resource and environmental carrying capacity for reconstruction planning. Progress in Geography, 36, 286-295(2017).

    [39] Imbalance of economy after disaster based on input-output model and path recovery. Chinese Journal of Management Science, 21, 121-128(2013).

    Kan ZHOU, Baoyin LIU, Jie FAN. Post-earthquake economic resilience and recovery efficiency in the border areas of the Tibetan Plateau: A case study of areas affected by the Wenchuan Ms 8.0 Earthquake in Sichuan, China in 2008[J]. Journal of Geographical Sciences, 2020, 30(8): 1363
    Download Citation