• Infrared and Laser Engineering
  • Vol. 50, Issue 9, 20200456 (2021)
Qiwen Jin1, Jian Guan2, and Xuecheng Wu1、*
Author Affiliations
  • 1State Key Laboratory of Clean Energy Utilization, Zhejiang University, Hangzhou 310027, China
  • 2Zhejiang Energy Group Co., Ltd, Hangzhou 310007, China
  • show less
    DOI: 10.3788/IRLA20200456 Cite this Article
    Qiwen Jin, Jian Guan, Xuecheng Wu. Experimental study on on-line monitoring pulverized coal fineness of 300 MW coal-fired plant by digital holography[J]. Infrared and Laser Engineering, 2021, 50(9): 20200456 Copy Citation Text show less
    Recording and reconstruction of digital holography
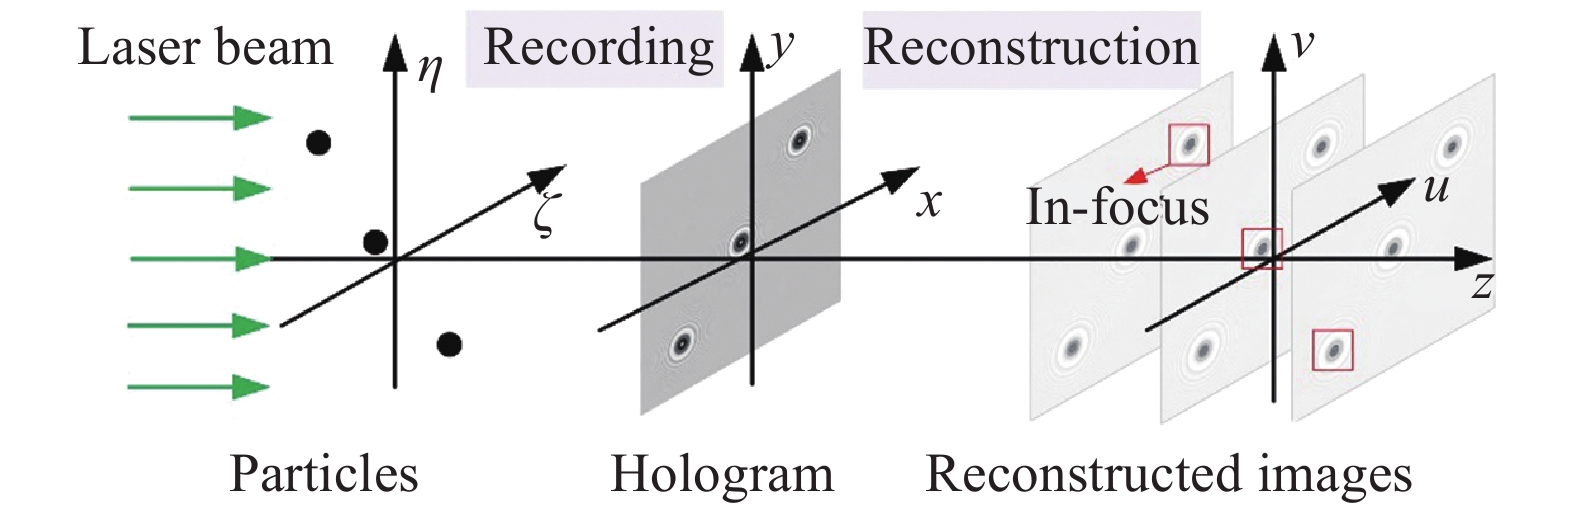
    Fig. 1. Recording and reconstruction of digital holography
    Schematic diagram of the measurement equipment
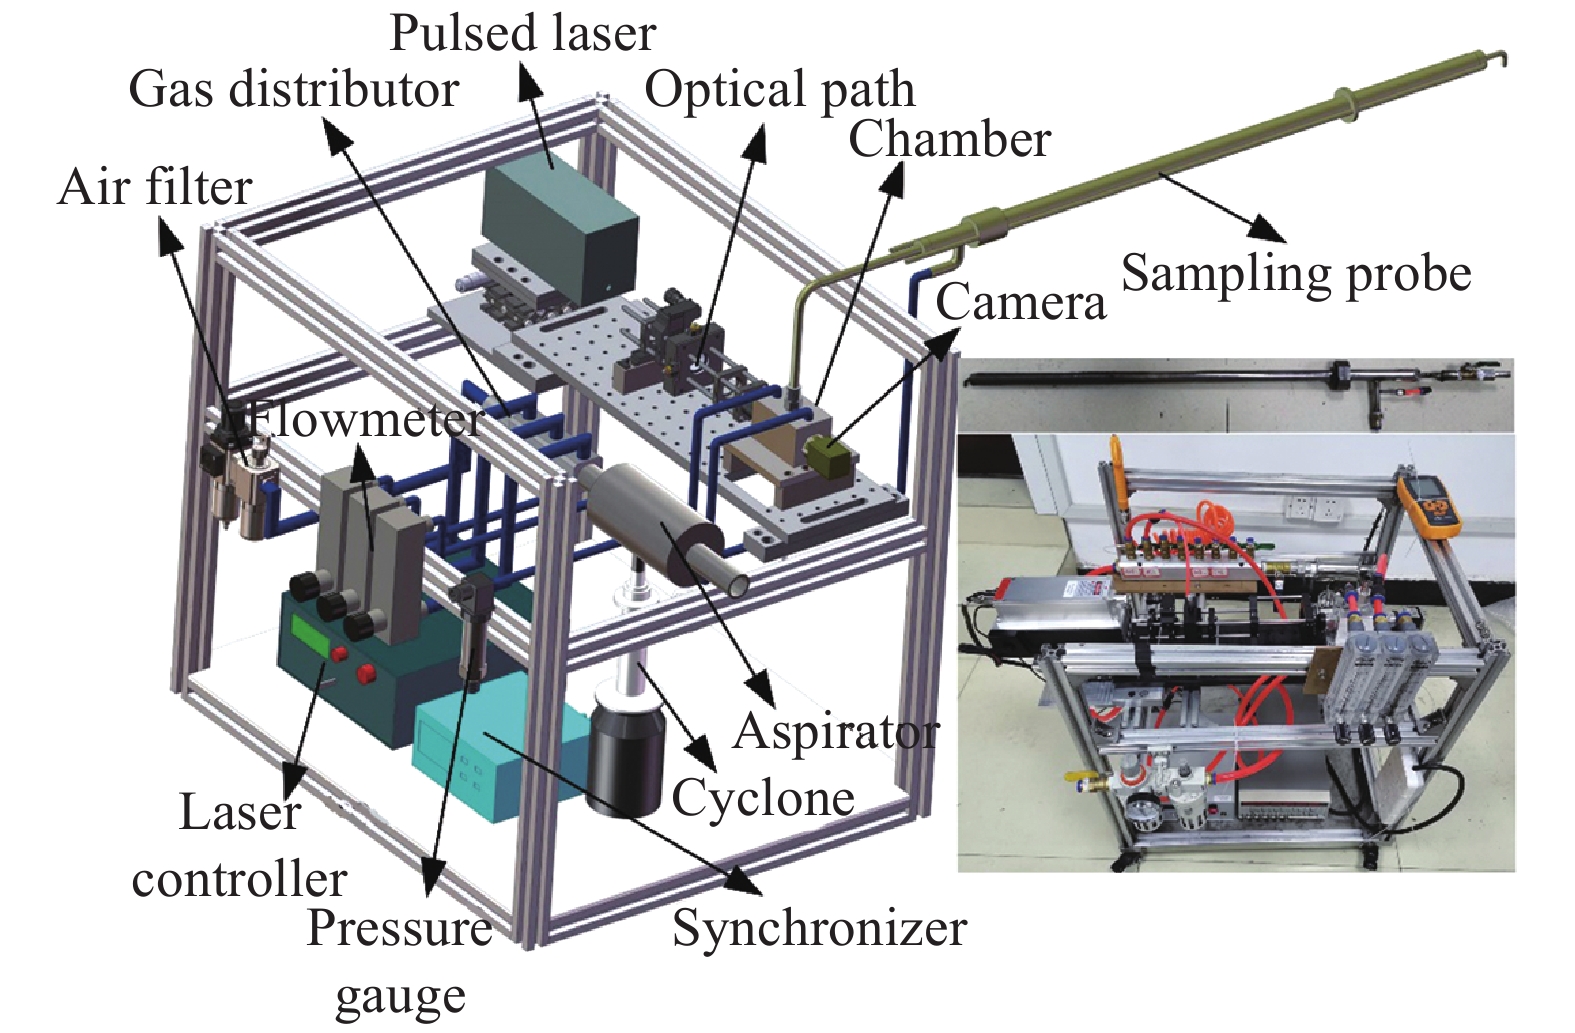
    Fig. 2. Schematic diagram of the measurement equipment
    (a) Gas system; (b) Light path system. 1-Gas source, 2-Air filter, 3-Gas distributor, 4-Ball valve group, 5-Flowmeter group, 6-Aspirator, 7-Cyclone, 8-Chamber, 9-Ball valve, 10-Pressure gauge, 11-Sampling probe, 12-Pipe, 13-Sampled coal flow, 14-Dilution gas, 15 and 16-Protection gas, 17-Ejector gas, 18-Laser, 19-Attenuator, 20-Spatial filter, 21-Lens, 22-Camera, 23-Laser controller, 24-Synchronizer, 25-Computer
    Fig. 3. (a) Gas system; (b) Light path system. 1-Gas source, 2-Air filter, 3-Gas distributor, 4-Ball valve group, 5-Flowmeter group, 6-Aspirator, 7-Cyclone, 8-Chamber, 9-Ball valve, 10-Pressure gauge, 11-Sampling probe, 12-Pipe, 13-Sampled coal flow, 14-Dilution gas, 15 and 16-Protection gas, 17-Ejector gas, 18-Laser, 19-Attenuator, 20-Spatial filter, 21-Lens, 22-Camera, 23-Laser controller, 24-Synchronizer, 25-Computer
    (a) Framework of the software; (b) Flow chart of holograms processing
    Fig. 4. (a) Framework of the software; (b) Flow chart of holograms processing
    On-site experiments
    Fig. 5. On-site experiments
    (a) and (d) are typical holograms of coal powders from mill B and D; (b) and (e) are reconstructed images of (a) and (d), while the particle size information are plotted in (c) and (f) respectively
    Fig. 6. (a) and (d) are typical holograms of coal powders from mill B and D; (b) and (e) are reconstructed images of (a) and (d), while the particle size information are plotted in (c) and (f) respectively
    and results obtained by different methods不同方法得到的和结果
    Fig. 7. and results obtained by different methods 不同方法得到的 和 结果
    Comparison of PSD of different methods. (a) Mill B; (b) Mill D
    Fig. 8. Comparison of PSD of different methods. (a) Mill B; (b) Mill D
    Online monitoring of pulverized coal fineness within 1 hour
    Fig. 9. Online monitoring of pulverized coal fineness within 1 hour
    ParameterUnitValue
    BD
    Air flowratet/h49.8850.28
    Coal flowratet/h23.122.05
    Diameter of pipesmm460460
    Temperature80.0380.05
    PressurekPa1.211.41
    Velocitym/s20.5920.90
    Concentrationkg/kg air0.460.44
    Table 1. Parameters of coal powder flow in primary pipes
    Qiwen Jin, Jian Guan, Xuecheng Wu. Experimental study on on-line monitoring pulverized coal fineness of 300 MW coal-fired plant by digital holography[J]. Infrared and Laser Engineering, 2021, 50(9): 20200456
    Download Citation