• Laser & Optoelectronics Progress
  • Vol. 57, Issue 24, 242802 (2020)
Wenbing Xu1、2 and Xiaojun Cheng1、*
Author Affiliations
  • 1College of Surveying and Geo-Informatics, Tongji University, Shanghai 200092, China
  • 2School of Environmental & Resource Sciences, Zhejiang A & F University, Hangzhou, Zhejiang 311300, China;
  • show less
    DOI: 10.3788/LOP57.242802 Cite this Article Set citation alerts
    Wenbing Xu, Xiaojun Cheng. Impact of Plant Surface Features on 3D Laser Point Cloud[J]. Laser & Optoelectronics Progress, 2020, 57(24): 242802 Copy Citation Text show less
    Influence of station distance on ranging accuracy of 3D laser scanner
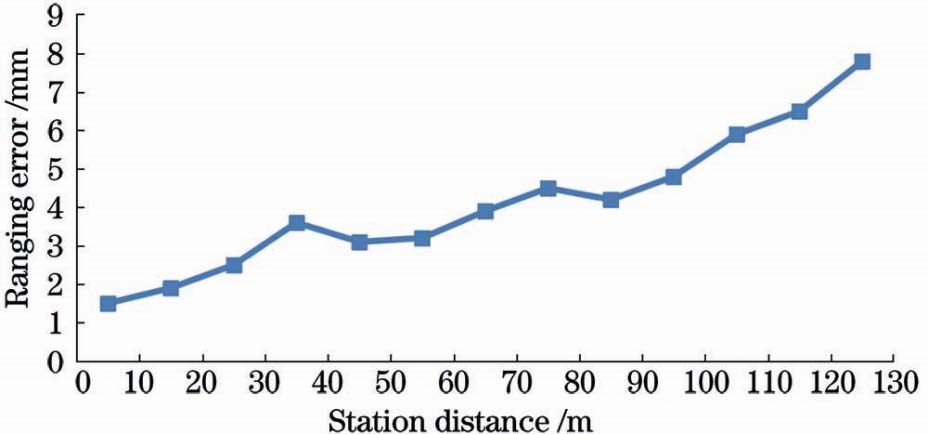
    Fig. 1. Influence of station distance on ranging accuracy of 3D laser scanner
    Average LiDAR data intensity of plants with different colors and roughnesses
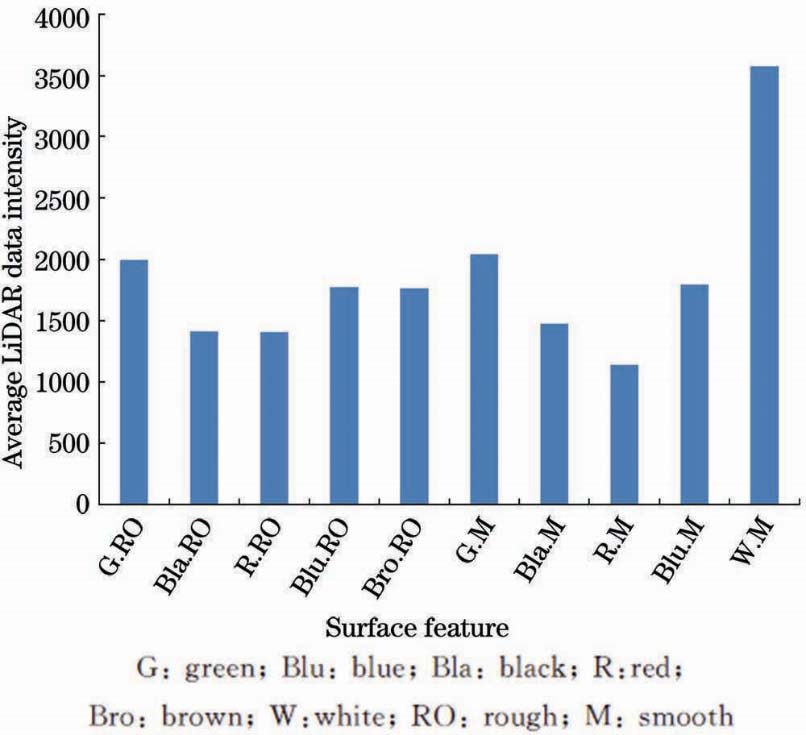
    Fig. 2. Average LiDAR data intensity of plants with different colors and roughnesses
    Difference of the average LiDAR data intensity of plants with different colors
    Fig. 3. Difference of the average LiDAR data intensity of plants with different colors
    Difference of the average LiDAR data intensity with different roughnesses
    Fig. 4. Difference of the average LiDAR data intensity with different roughnesses
    Images of walls point clouds with different colors. (a) Blue; (b) black; (c) red; (d) white; (e) green
    Fig. 5. Images of walls point clouds with different colors. (a) Blue; (b) black; (c) red; (d) white; (e) green
    Observed objectColorRoughnessObserved objectColorRoughness
    Salix babylonica L.GreenSmoothUlmus pumilavar pendulaGreenRough
    Photinia serrulataRedSmoothPrunus cerasifera EhrhRedRough
    Selaginella uncinataBlueSmoothBlue wallBlueRough
    Michelia chapensis DandyBlackSmoothCaryaBlackRough
    Michelia alba DC.WhiteSmoothGinkgo biloba L.BlackRough
    Phyllostachys edulisGreenSmoothMoso bamboo shootBrownRough
    Table 1. Plant objects observed and its features
    No.XYZ
    13799.353-8587.8391528.367
    23797.462-8578.2701527.036
    33796.244-8568.9791527.605
    43796.741-8587.7141519.758
    53799.593-8578.7001518.189
    63799.745-8569.9131518.526
    73799.684-8587.5841509.643
    83799.356-8578.4691509.250
    93798.167-8569.2511509.496
    Mean value3798.483-8578.5241518.652
    Reference value3796.700-8578.0001512.000
    Difference value1.783-0.5246.652
    Table 2. Coordinate and spatial error of the sampled laser point unit:mm
    Observed plantSurface featureAverage intensity
    Ulmus pumilavar pendulaGreen+rough1994
    Salix babylonica L.Green+smooth1964
    CaryaBlack+rough1383
    Michelia chapensis DandyBlack+smooth1475
    Prunus cerasifera EhrhRed+rough1408
    Photinia serrulataRed+smooth1139
    Blue wallBlue+rough1777
    Selaginella uncinataBlue+smooth1795
    Ginkgo biloba L.Black+rough1445
    Michelia alba DC.White+smooth3577
    Moso bamboo shootBrown+rough1766
    Phyllostachys edulisGreen+smooth2118
    Table 3. LiDAR data intensity of plants with different colors and roughnesses
    Observed objectColors of surfaceAverage intensityIntensity difference
    Selaginella uncinataBlue1795-336
    Blue wallBlue2131
    Michelia chapensis DandyBlack1475-239
    Black wallBlack1714
    Photinia serrulataRed1139-695
    Red wallRed1834
    Michelia alba DC.White3577-1298
    White wallWhite4875
    Salix babylonica L.Green1964-1001
    Green wallGreen2965
    Table 4. Comparison of the color influence on LiDAR data intensity of plant and wall
    Wenbing Xu, Xiaojun Cheng. Impact of Plant Surface Features on 3D Laser Point Cloud[J]. Laser & Optoelectronics Progress, 2020, 57(24): 242802
    Download Citation