
Xin Jiang, Nian Fang, Lutang Wang. Ultra-Broadband Microwave Frequency Comb Generated from Cascaded Optically Injected Semiconductor Lasers[J]. Laser & Optoelectronics Progress, 2018, 55(12): 121403
- Laser & Optoelectronics Progress
- Vol. 55, Issue 12, 121403 (2018)
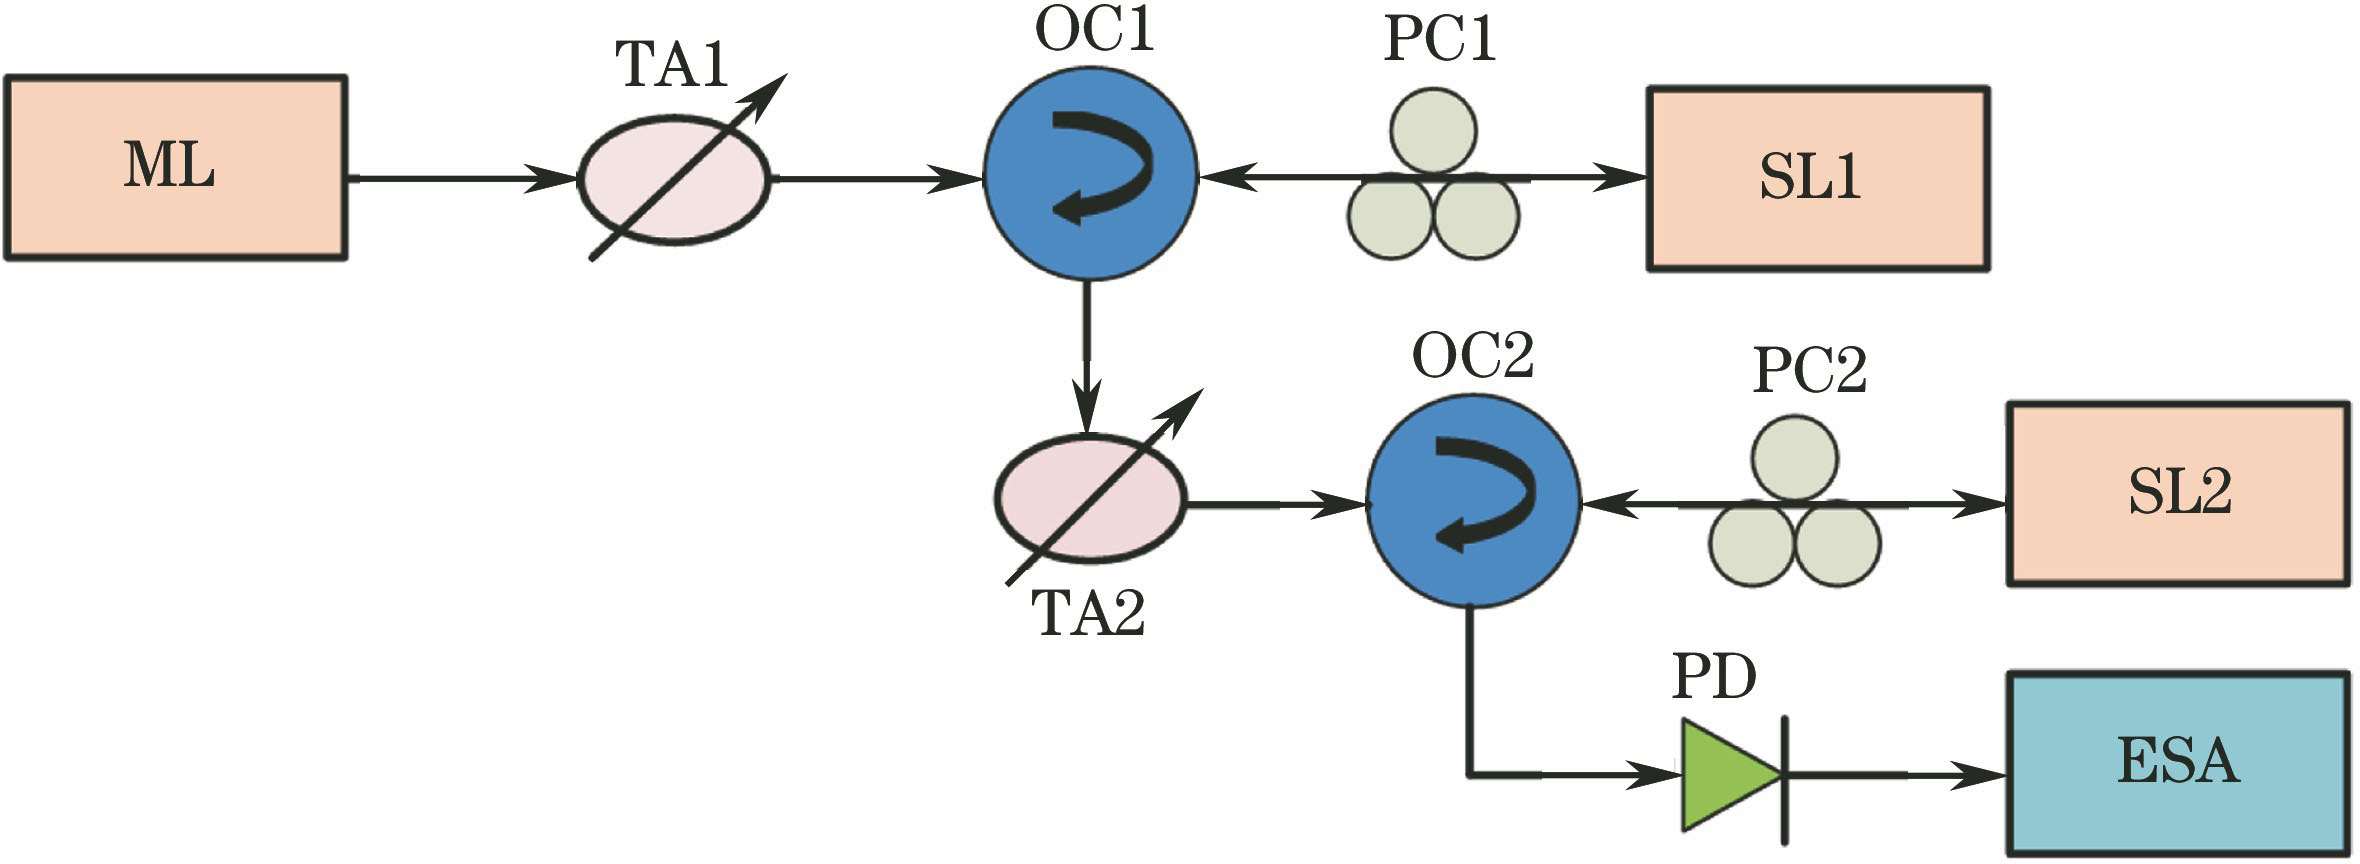
Fig. 1. Scheme for MFC generation through cascaded optically injected semiconductor lasers
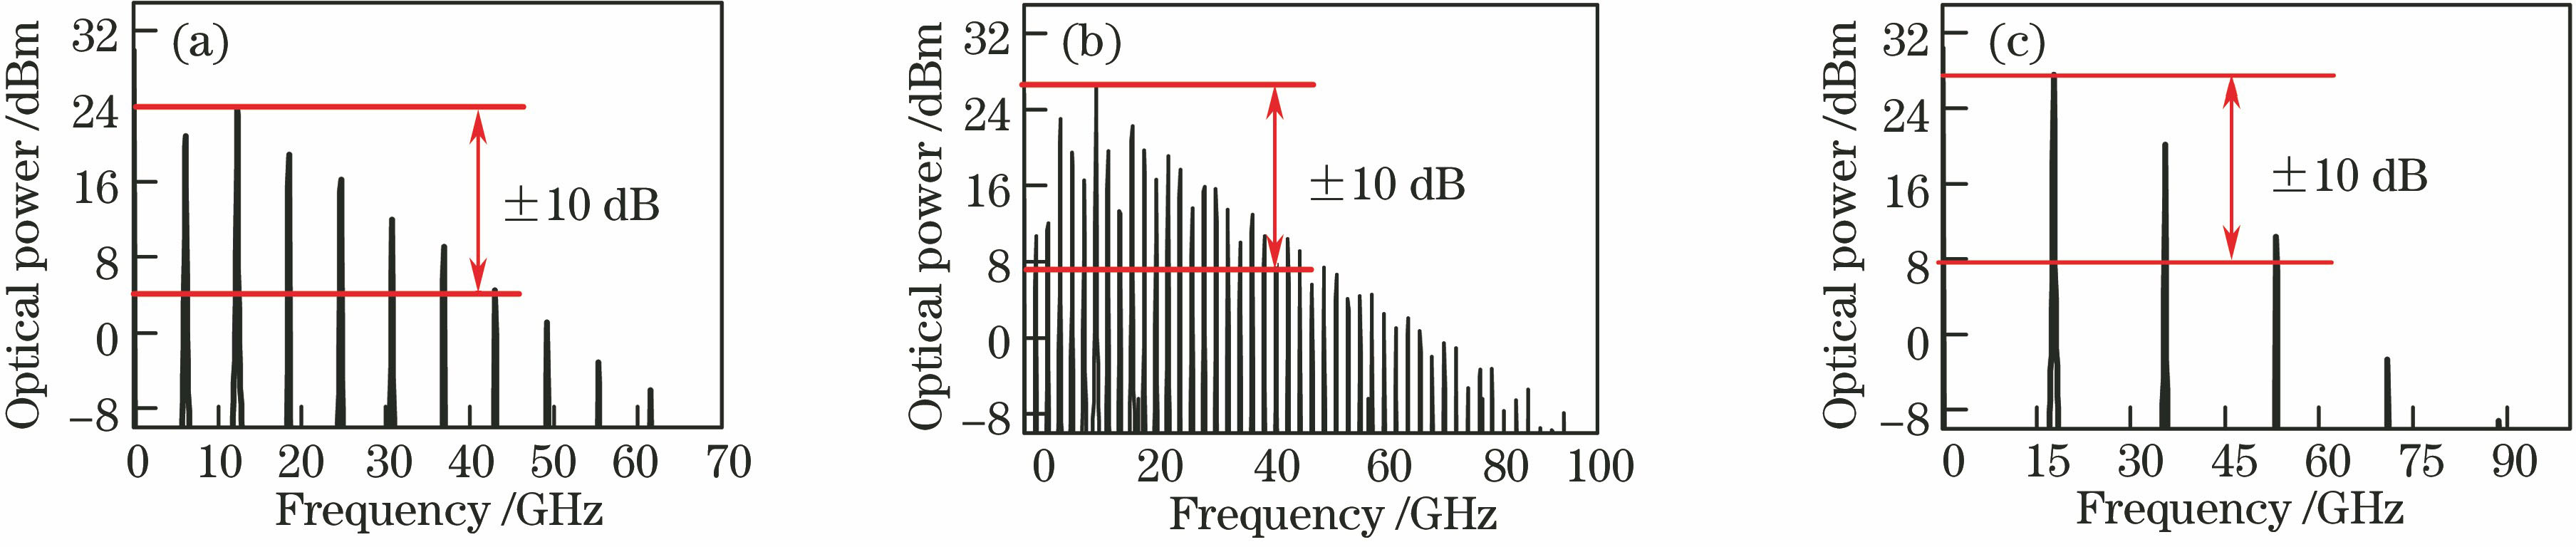
Fig. 2. Output power spectra of SL1 under different injection strengths at frequency detuning of 10 GHz. (a) ξi=0.03; (b) ξi=0.047; (c) ξi=0.1
Fig. 3. Number of comb lines and bandwidth versus injection strength at frequency detuning of 10 GHz and amplitude variation of ±10 dB for MFCs generated by SL1
Fig. 4. Output power spectra of SL1 under different frequency detunings at injection strength of 0.04. (a) fi=7 GHz; (b) fi=10 GHz; (c) fi=12 GHz
Fig. 5. Number of comb lines and bandwidth versus frequency detuning at injection strength of 0.04 and amplitude variation of ±10 dB for MFCs generated by SL1
Fig. 6. Output power spectra of SL2 under different injection strengths at frequency detuning of 10 GHz. (a) ξi=0.03; (b) ξi=0.1; (c) ξi=0.2
Fig. 7. Number of comb lines and bandwidth versus injection strength at frequency detuning of 10 GHz and amplitude variation of ±10 dB for MFCs generated by SL2
Fig. 8. Output power spectra of SL2 under different frequency detunings at injection strength of 0.2. (a) fi=6 GHz; (b) fi=31 GHz; (c) fi=55 GHz
Fig. 9. Number of comb lines and bandwidth versus frequency detuning at injection strength of 0.2 and amplitude variation of ±10 dB for MFCs generated by SL2
Fig. 10. MFC effect comparison for single and cascaded injections. (a) Single injection (0.04, 10 GHz); (b) cascaded injection (0.2, 55 GHz); (c) cascaded injection (0.2, 47 GHz)

Set citation alerts for the article
Please enter your email address
© Copyright 2018-2021 | Chinese Laser Press. All Rights Reserved 沪ICP备15018463号-20