• Photonics Research
  • Vol. 2, Issue 6, 168 (2014)
Hai Liu, Zhaoli Zhang, Jianwen Sun, and and Sanya Liu*
Author Affiliations
  • National Engineering Research Center for E-Learning, Central China Normal University, Wuhan 430079, China
  • show less
    DOI: 10.1364/PRJ.2.000168 Cite this Article Set citation alerts
    Hai Liu, Zhaoli Zhang, Jianwen Sun, and Sanya Liu. Blind spectral deconvolution algorithm for Raman spectrum with Poisson noise[J]. Photonics Research, 2014, 2(6): 168 Copy Citation Text show less
    Illustration of TR and MTR constraints on three types: flat region, noise region, and structure region. (a) Tikhonov regularization. (b) Modified Tikhonov regularization can distinguish different regions.
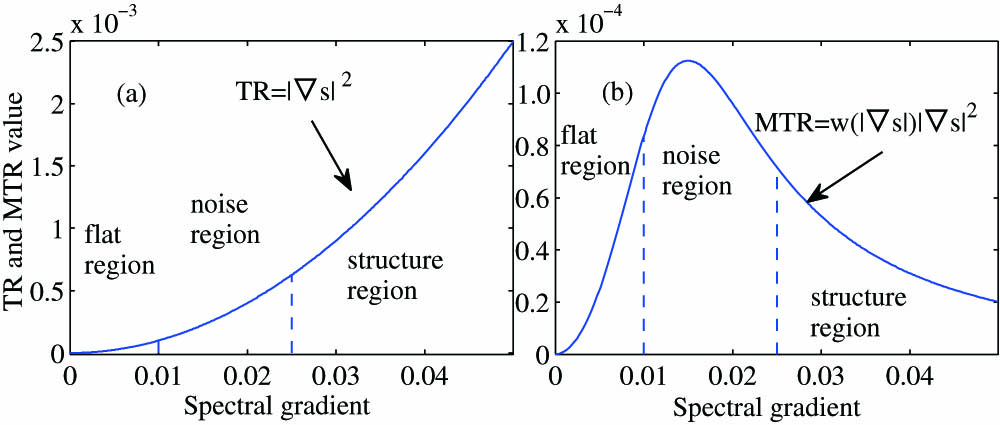
    Fig. 1. Illustration of TR and MTR constraints on three types: flat region, noise region, and structure region. (a) Tikhonov regularization. (b) Modified Tikhonov regularization can distinguish different regions.
    Simulation experiment. (a) Raman spectrum of methyl formate (C2H4O2) from 400 to 1500 cm−1. (b) Overlap spectrum. (c) Contaminated by Poisson noise. (d) RL. (e) TR-RL. (f) MTR-RL.
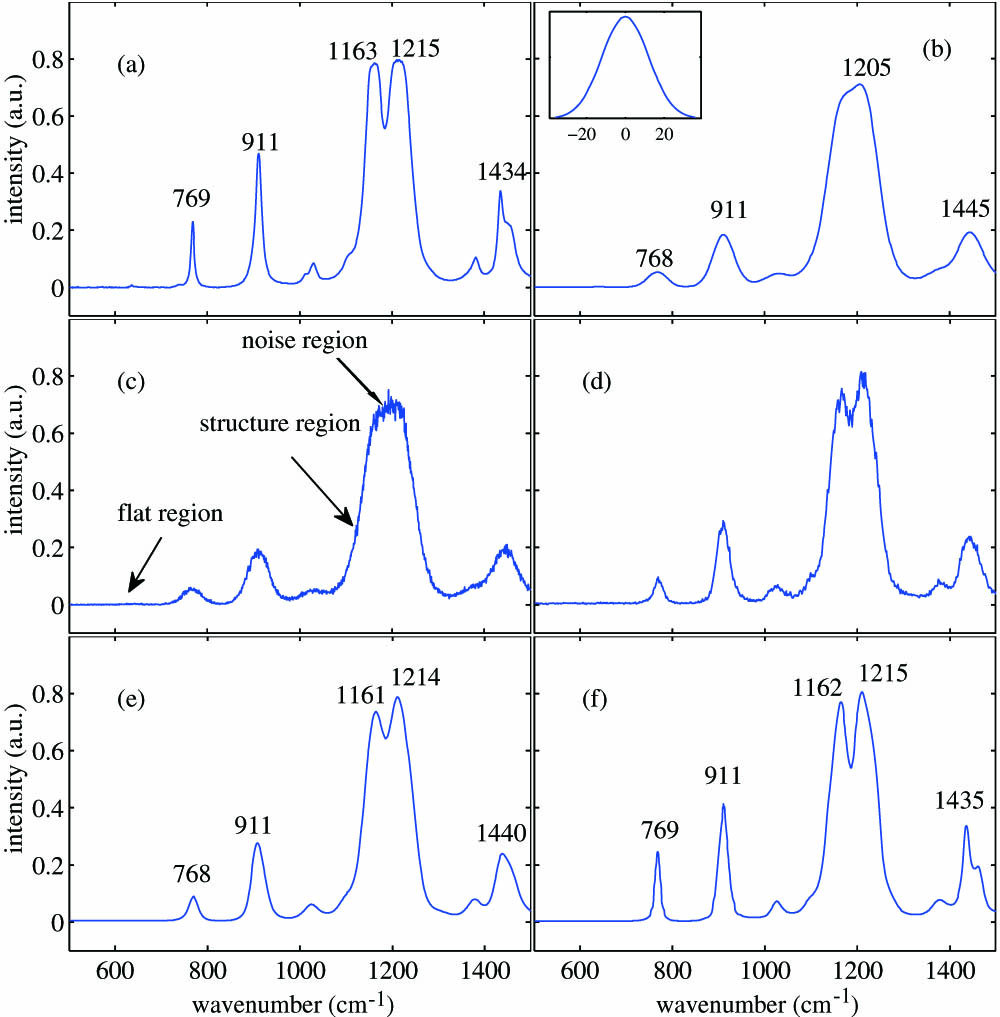
    Fig. 2. Simulation experiment. (a) Raman spectrum of methyl formate (C2H4O2) from 400 to 1500cm1. (b) Overlap spectrum. (c) Contaminated by Poisson noise. (d) RL. (e) TR-RL. (f) MTR-RL.
    NMSE versus regularization parameter of TR-RL and MTR-RL for the Raman spectrum of methyl formate (C2H4O2).
    Fig. 3. NMSE versus regularization parameter of TR-RL and MTR-RL for the Raman spectrum of methyl formate (C2H4O2).
    NMSE versus the iteration number of the three methods for the Raman spectrum [methyl formate (C2H4O2)].
    Fig. 4. NMSE versus the iteration number of the three methods for the Raman spectrum [methyl formate (C2H4O2)].
    Real Raman spectrum experiment. (a) Cr:LisAF crystal [13] from 300 to 900 nm, deconvolution by (b) TR-RL and (c) MTR-RL. (d) Estimated instrument function.
    Fig. 5. Real Raman spectrum experiment. (a) Cr:LisAF crystal [13] from 300 to 900 nm, deconvolution by (b) TR-RL and (c) MTR-RL. (d) Estimated instrument function.
    Real Raman deconvolution experiment. (a) Raman spectrum of (D+)-glucopyranose [14] from 10 to 700 cm−1. (b) MTR-RL result.
    Fig. 6. Real Raman deconvolution experiment. (a) Raman spectrum of (D+)-glucopyranose [14] from 10 to 700cm1. (b) MTR-RL result.
      Spectral Deconvolution by
    SpectraDegraded SpectrumFSD [4]RL [9]TR-RLMTR-RL
    C2H4O20.04510.02720.02310.02400.0219
    C9H10O20.02230.01950.01360.01050.0092
    C4H4S0.04800.03150.02310.01980.0184
    Table 1. NMSE of Measured Spectrum and the Best Deconvolution Spectrum (with the Lowest NMSE by Different Algorithms)
    SpectrumFSD[4]RL[9]TR-RLMTR-RL
    Raman 11.471.503.613.98
    (1.10)(1.32)(2.20)(2.35)
    Raman 21.672.284.504.71
    (1.18)(1.91)(2.18)(2.46)
    Raman 31.251.783.613.81
    (1.68)(1.71)(2.22)(2.31)
    Raman 41.872.212.903.04
    (1.41)(1.75)(2.31)(2.40)
    Raman 51.452.162.853.29
    (1.02)(1.01)(1.80)(1.96)
    Raman 61.882.433.013.21
    (1.10)(1.22)(1.56)(1.76)
    Raman 71.711.982.502.61
    (1.24)(1.31)(1.68)(2.01)
    Raman 81.421.682.312.58
    (1.89)(2.11)(2.48)(2.86)
    Table 2. FWHMR and NSR (in Brackets) Values of Different Deconvolution Methods on the Real Raman Spectraa
    Hai Liu, Zhaoli Zhang, Jianwen Sun, and Sanya Liu. Blind spectral deconvolution algorithm for Raman spectrum with Poisson noise[J]. Photonics Research, 2014, 2(6): 168
    Download Citation