• Laser & Optoelectronics Progress
  • Vol. 55, Issue 11, 111404 (2018)
Yiying Zhang1、**, Yan Cao1、***, Yuxiang Chen2、*, and Xiangwei Mu1
Author Affiliations
  • 1 School of Maritime Economics and Management, Dalian Maritime University, Dalian, Liaoning 116026, China
  • 2 College of Applied Technology, University of Science and Technology Liaoning, Anshan, Liaoning 114051, China
  • show less
    DOI: 10.3788/LOP55.111404 Cite this Article Set citation alerts
    Yiying Zhang, Yan Cao, Yuxiang Chen, Xiangwei Mu. Quality Optimization of Laser-Cutted Ni-Based Alloys Based on Genetic Algorithm[J]. Laser & Optoelectronics Progress, 2018, 55(11): 111404 Copy Citation Text show less
    Schematic of laser-cutting process
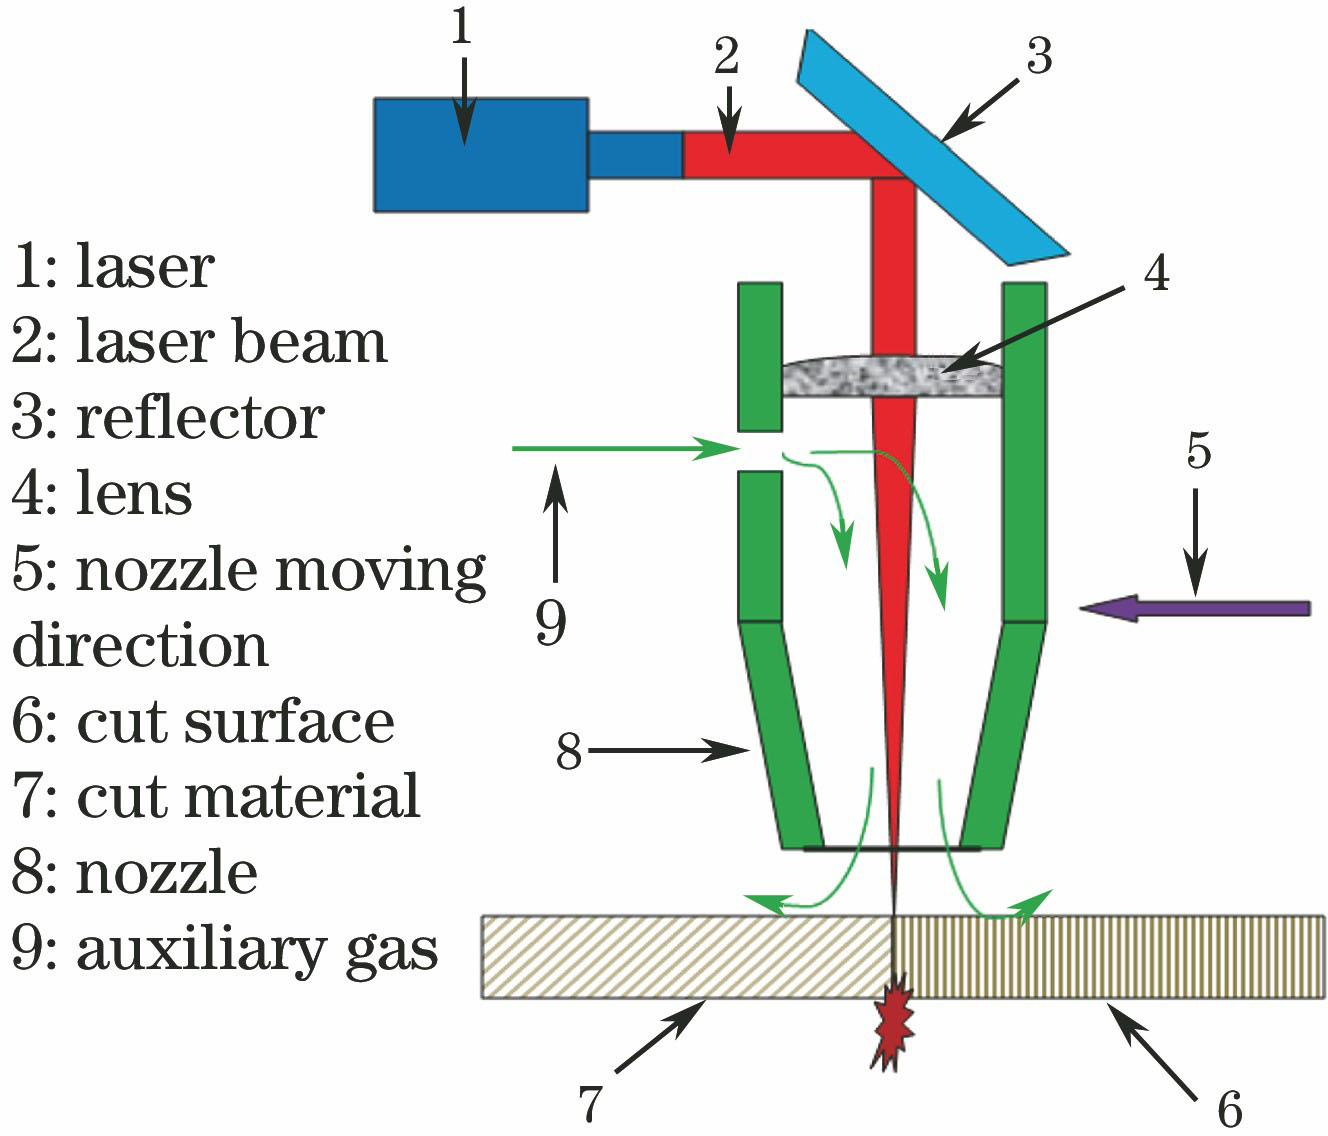
    Fig. 1. Schematic of laser-cutting process
    Exp erimental macrograph
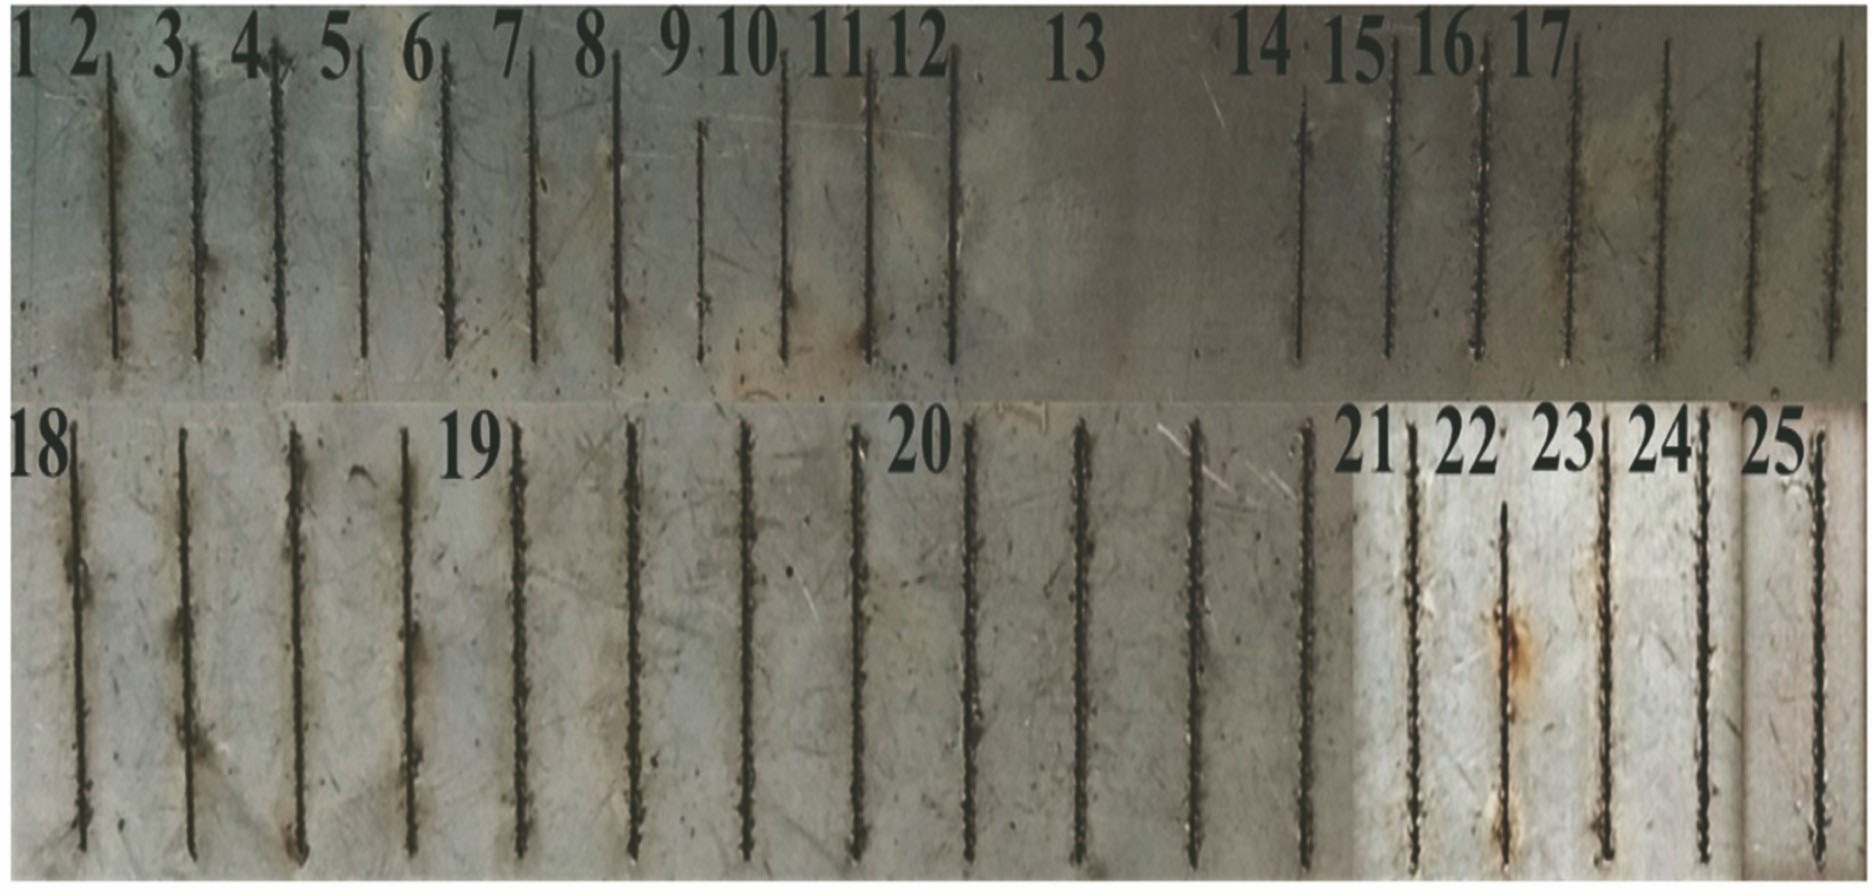
    Fig. 2. Exp erimental macrograph
    Mark graph of metallographic data of samples. (a) No. 2; (b) No. 3; (c) No. 4; (d) No. 5; (e) No. 6; (f) No. 7; (g) No. 8; (h) No. 9; (i) No. 10; (j) No. 11; (k) No. 12; (l) No. 14; (m) No. 15; (n) No. 16; (o) No. 17; (p) No. 18; (q) No. 19; (r) No. 20; (s) No. 21; (t) No. 22; (u) No. 23; (v) No. 24; (w) No. 25
    Fig. 3. Mark graph of metallographic data of samples. (a) No. 2; (b) No. 3; (c) No. 4; (d) No. 5; (e) No. 6; (f) No. 7; (g) No. 8; (h) No. 9; (i) No. 10; (j) No. 11; (k) No. 12; (l) No. 14; (m) No. 15; (n) No. 16; (o) No. 17; (p) No. 18; (q) No. 19; (r) No. 20; (s) No. 21; (t) No. 22; (u) No. 23; (v) No. 24; (w) No. 25
    Four-time sampling figures of samples from No. 17 to No. 20. (a) No. 17, first sampling; (b) No. 17, second sampling; (c) No. 17, third sampling; (d) No. 17, fourth sampling; (e) No. 18, first sampling; (f) No. 18, second sampling; (g) No. 18, third sampling; (h) No. 18, fourth sampling; (i) No. 19, first sampling; (j) No. 19, second c sampling; (k) No. 19, third sampling; (l) No. 19, fourth sampling; (m) No. 20, first sampling; (n) No. 20, second sampling; (o) No. 20, third sampling; (p) No. 20
    Fig. 4. Four-time sampling figures of samples from No. 17 to No. 20. (a) No. 17, first sampling; (b) No. 17, second sampling; (c) No. 17, third sampling; (d) No. 17, fourth sampling; (e) No. 18, first sampling; (f) No. 18, second sampling; (g) No. 18, third sampling; (h) No. 18, fourth sampling; (i) No. 19, first sampling; (j) No. 19, second c sampling; (k) No. 19, third sampling; (l) No. 19, fourth sampling; (m) No. 20, first sampling; (n) No. 20, second sampling; (o) No. 20, third sampling; (p) No. 20
    Three-layer BP network
    Fig. 5. Three-layer BP network
    Resutls predicted by BP neural network. (a) Comparison between predicted value and expected value; (b) error; (c) percentage of error
    Fig. 6. Resutls predicted by BP neural network. (a) Comparison between predicted value and expected value; (b) error; (c) percentage of error
    Flow chart of algorithm
    Fig. 7. Flow chart of algorithm
    Fitness value curve
    Fig. 8. Fitness value curve
    Experimental diagram for test. (a) Positive macrograph; (b) back macrograph; (c) metallographic micrograph
    Fig. 9. Experimental diagram for test. (a) Positive macrograph; (b) back macrograph; (c) metallographic micrograph
    CompositionNiCrWMoAlTiFeBZrCe
    ValueBal.19.0-22.07.5-9.07.5-9.00.4-0.80.4-0.81.00.0050.040.05
    Table 1. Chemical compositions of GH3128 (mass fraction,%)
    SymbolFactorLevel 1Level 2Level 3Level 4Level 0
    AElectric current /A200210220230215
    BPulse width /ms0.811.21.41.1
    CCutting speed /(mm·min-1)150200250300225
    DDefocusing amount /mm-1-0.50.510
    Table 2. Factor levels
    No.Level ofABCDS /μmK /μml/L /%ScNo.Level ofABCDS /μmK/μml/L /%Sc
    111110000144231170171.58470.85
    21222155177.510084.5154324272.519310077.08
    3133326019510077.5164413417.5209.510068.18
    41444262.520010076.88170000242.4148.87510082.99
    52123157.5159.510086.18182222169.9178.62510083.64
    6221425022410075.1193333213183.37510081.01
    72341197.5171.510082.98204444310.5204.7510074
    82432102.526210078.68211000207.516210083.43
    93134132.5109.58073.94222111190161.58168.32
    103243172.515510085.88233222220128.510086.15
    11331217521910079.35244333165183.510083.4
    123421235273.510070.9250444247.519510078.13
    1341420000
    Table 3. Comprehensive scores of samples
    No.SampleS /μmK /μmScError /%Average
    17132815578.1-6.2682.99
    2211.516283.2250.28
    3192.513387.0754.69
    4237.5145.583.5750.69
    18117918182.95-0.8383.64
    218818682-2
    3157.5166.585.4752.15
    415518184.150.61
    191221.517681.3250.3981.01
    2221.5176.581.2750.33
    3221.518180.825-0.23
    4187.520080.625-0.48
    201326.5190.574.6250.8474
    2283.521973.925-0.1
    3322.5209.572.925-1.47
    4309.520074.5250.7
    Table 4. Sample errors
    Number of nodes23456789101112
    Error31.8915.6219.9516.5318.8617.6625.1219.4711.2637.3357.09
    Table 5. Hidden layer node errors
    Yiying Zhang, Yan Cao, Yuxiang Chen, Xiangwei Mu. Quality Optimization of Laser-Cutted Ni-Based Alloys Based on Genetic Algorithm[J]. Laser & Optoelectronics Progress, 2018, 55(11): 111404
    Download Citation