• Infrared and Laser Engineering
  • Vol. 49, Issue 12, 20201067 (2020)
Yi He1, Renqin Dou2, Haotian Zhang1, Wenpeng Liu2, Qingli Zhang2, Yingying Chen1, Yuxi Gao1, and Jianqiao Luo2
Author Affiliations
  • 1The Key Laboratory of Photonic Devices and Materials, Anhui Province, Anhui Institute of Optics and Fine Mechanics, Hefei institutes of Physical Science, Chinese Academy of Sciences, Hefei 230031, PR China
  • 2The Key Laboratory of Photonic Devices and Materials, Anhui Province, Anhui Institute of Optics and Fine Mechanics, Hefei institutes of Physical Science, Chinese Academy of Sciences, Hefei 230031, PR China
  • show less
    DOI: 10.3788/IRLA20201067 Cite this Article
    Yi He, Renqin Dou, Haotian Zhang, Wenpeng Liu, Qingli Zhang, Yingying Chen, Yuxi Gao, Jianqiao Luo. Growth, structure, and spectroscopic properties of Yb,Ho,Pr:GYTO single crystal (Invited)[J]. Infrared and Laser Engineering, 2020, 49(12): 20201067 Copy Citation Text show less
    (a) Photograph of the as-grown Yb,Ho,Pr:GYTO crystal; (b) , , and -oriented wafers of Yb,Ho,Pr:GYTO crystal
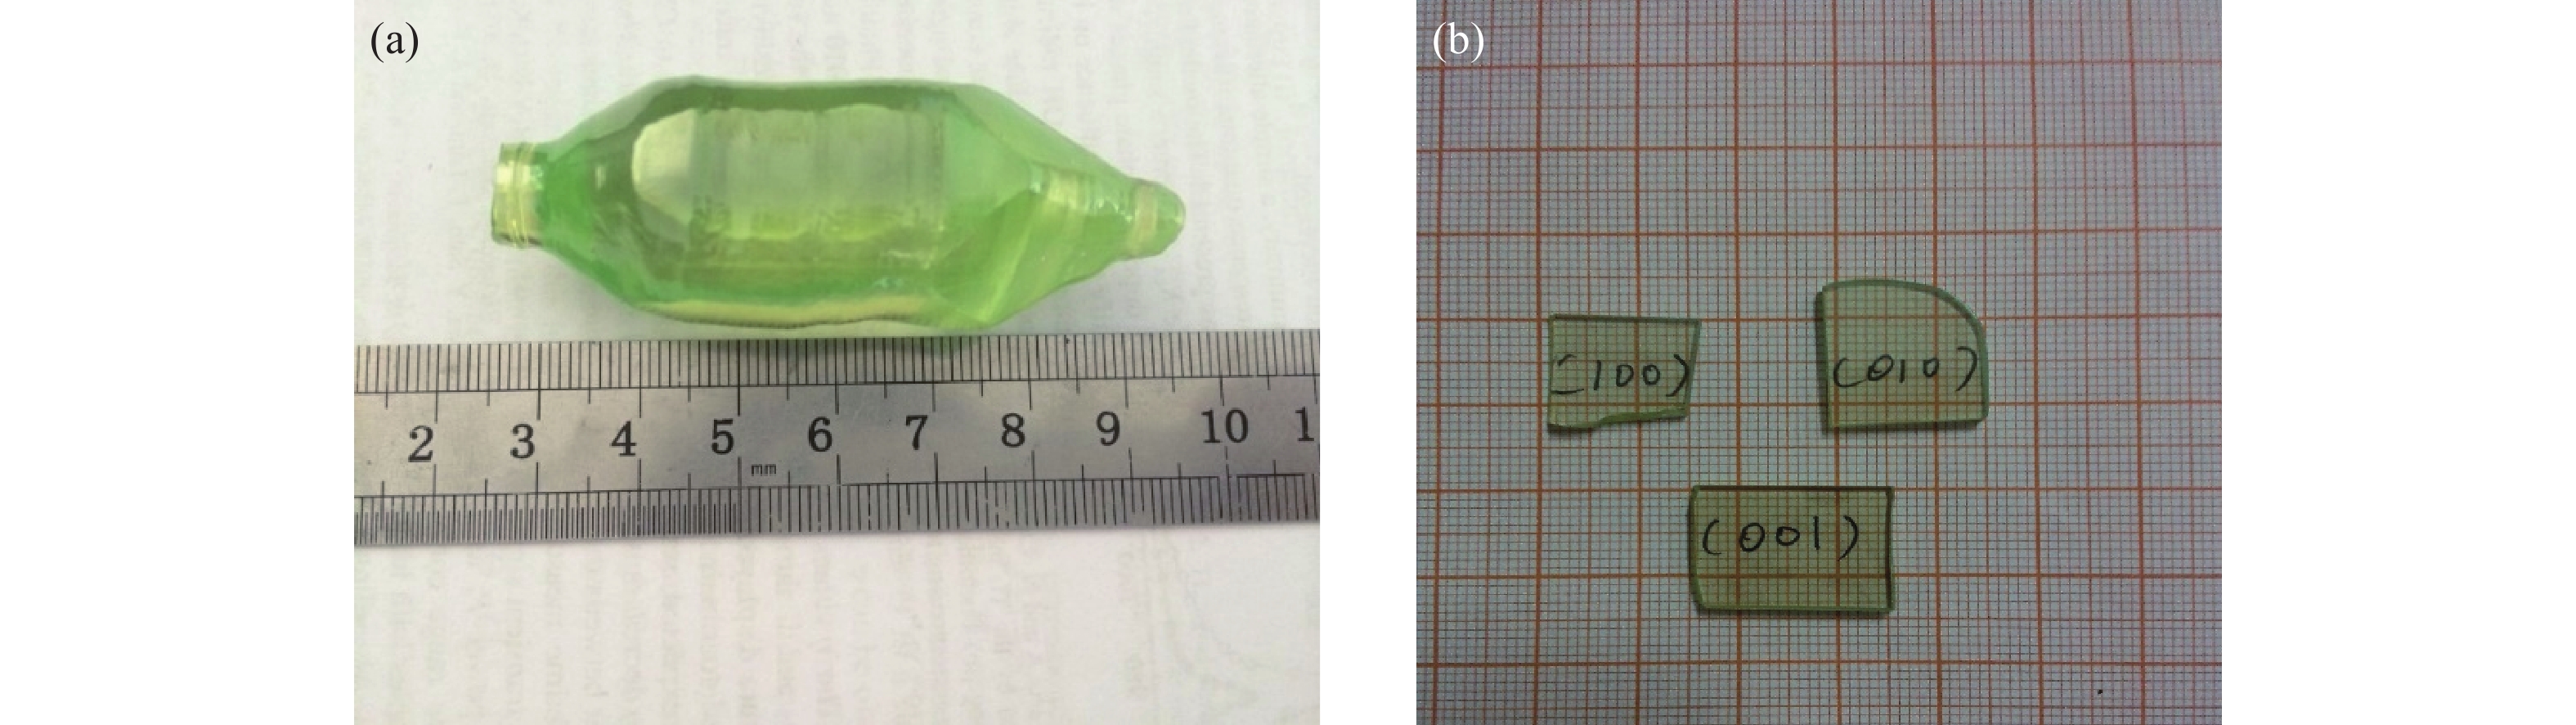
    Fig. 1. (a) Photograph of the as-grown Yb,Ho,Pr:GYTO crystal; (b) <100>, <010>, and <001>-oriented wafers of Yb,Ho,Pr:GYTO crystal
    XRD patterns of Yb,Ho,Pr:GYTO single crystal
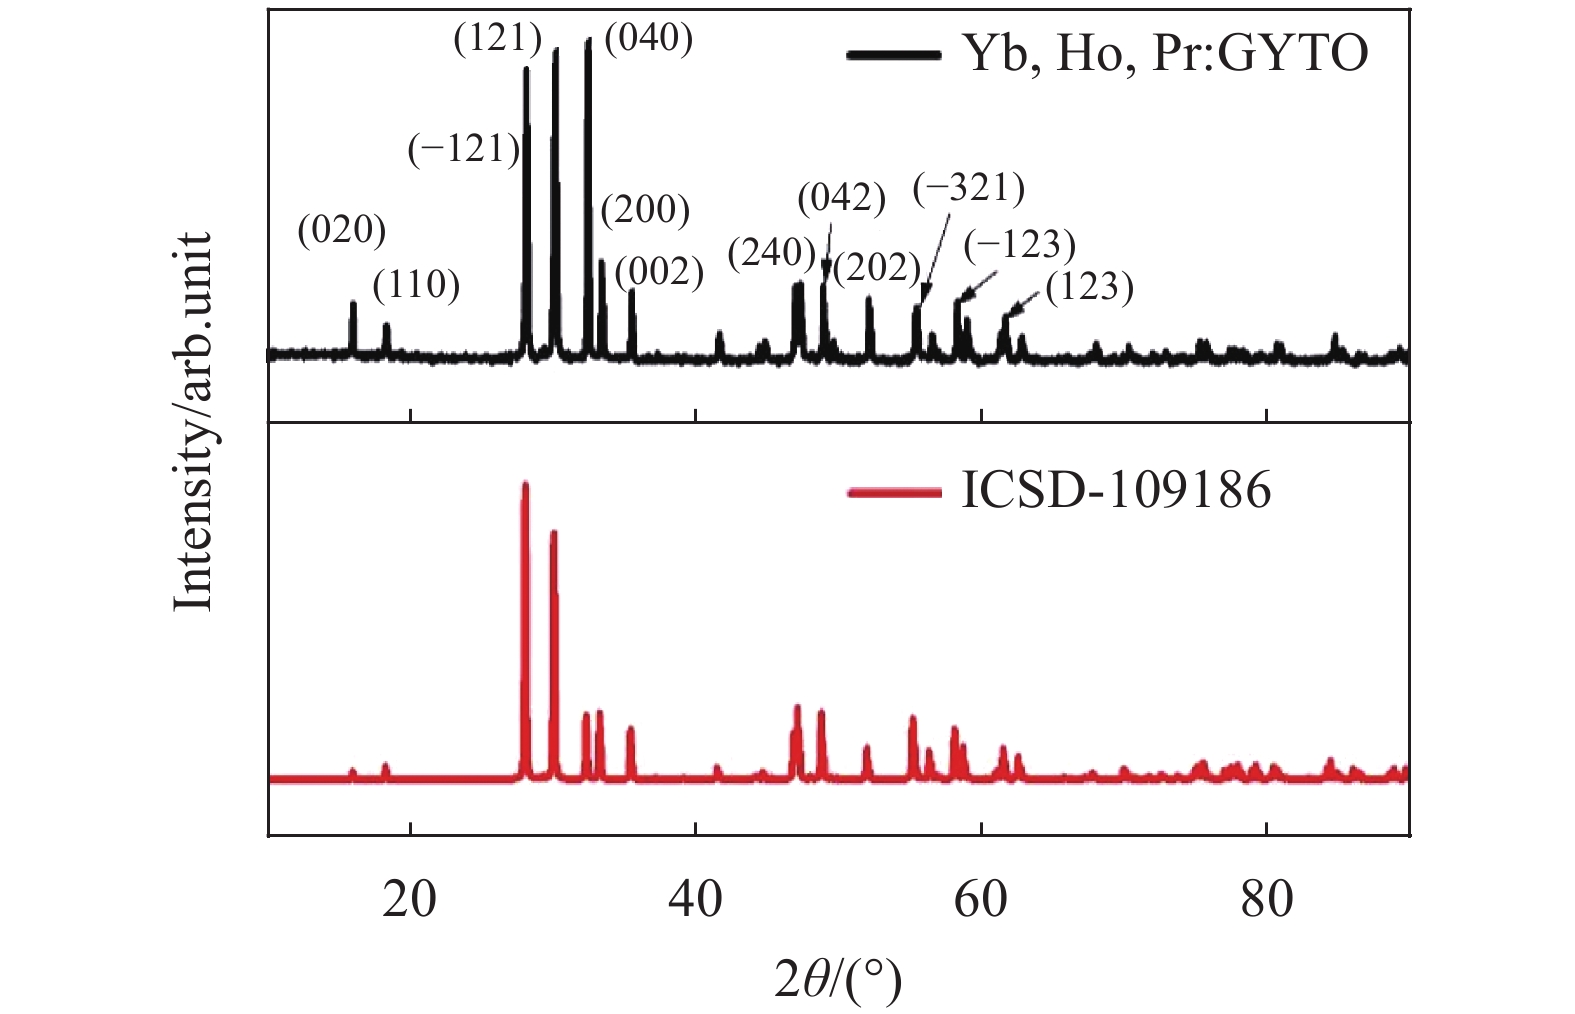
    Fig. 2. XRD patterns of Yb,Ho,Pr:GYTO single crystal
    Rietveld refinement results from the XRD data of Yb,Ho,Pr:GYTO crystal
    Fig. 3. Rietveld refinement results from the XRD data of Yb,Ho,Pr:GYTO crystal
    X-ray rocking curves of Yb,Ho,Pr:GYTO crystal
    Fig. 4. X-ray rocking curves of Yb,Ho,Pr:GYTO crystal
    (a) Polarized absorption spectra of Yb,Ho,Pr:GYTO; (b) Comparization of Polarized absorption spectra of Yb,Ho,Pr:GYTO and Yb,Ho:GYTO in 850-1100 nm (a, b, c →Yb,Ho,Pr:GYTO; a’, b’, c’ →Yb,Ho:GYTO)
    Fig. 5. (a) Polarized absorption spectra of Yb,Ho,Pr:GYTO; (b) Comparization of Polarized absorption spectra of Yb,Ho,Pr:GYTO and Yb,Ho:GYTO in 850-1100 nm (a, b, c →Yb,Ho,Pr:GYTO; a’, b’, c’ →Yb,Ho:GYTO)
    2.9 μm emission spectrum of Yb,Ho,Pr:GYTO crystal
    Fig. 6. 2.9 μm emission spectrum of Yb,Ho,Pr:GYTO crystal
    Fluorescence decay curves. (a) 1204 nm (5I6→5I8); (b) 2068 nm(5I7→5I8)
    Fig. 7. Fluorescence decay curves. (a) 1204 nm (5I65I8); (b) 2068 nm(5I75I8)
    Schematic of energy transfer processes among Yb3+, Ho3+, and Pr3+ ions
    Fig. 8. Schematic of energy transfer processes among Yb3+, Ho3+, and Pr3+ ions
    AtomXYZWyckoff siteUiso
    Cell parameters: a=5.381 Å, b=11.023 Å, c=5.076 Å, β=95.59°; Cell volume: V=299.68 Å3; Space group: Monoclinic, I2/a (No.15); Density: ρ=8.630 g/cm3; Reliability factors(R-factor): Rp=9.72%, Rwp=7.21%
    Gd0.250.6210000.04a0.025
    Y0.250.6210000.04a0.025
    Yb0.250.6210000.04a0.025
    Ho0.250.6210000.04a0.025
    Pr0.250.6210000.04a0.025
    Ta0.250.1450000.04a0.025
    O10.0940000.4600000.2540008c0.025
    O2−0.007000.7170000.2930008c0.025
    Table 1. Structural parameters obtained by Rietveld refinement
    ElementStarting material (at %)Crystal (at %)keff (Cs/C0)
    Yb0.050.03120.624
    Ho0.010.01221.220
    Pr0.0020.00271.350
    Y0.20.19530.977
    Table 2. Effective segregation coefficients (keff) of Yb, Ho, Pr, and Y in Yb,Ho,Pr:GYTO crystal
    CrystalsEmission cross section (10−20 cm2)
    Yb,Ho,Pr:GYTO (this work)14.4
    Ho:GYTO[25]12.6
    Yb,Ho:GYTO[27]18.9
    Ho:LaF3[29]0.63
    Ho:LuLF[30]1.7
    Ho:PbF2[31]1.44
    Table 3. Comparison of the emission cross section for 2.9 μm in the different Ho3+ doped crystals
    CrystalHo (5I7)/ms Ho (5I6)/ μs
    Yb,Ho:YSGG[[32]]10.2585
    Tm,Ho:YAG[[33]]11.440
    Yb,Ho,Pr:YAP[[24]]1.258341
    Ho:GYTO[[25]]8.081311
    Tm,Ho:GYTO[[26]]4.09131
    Yb,Ho,Pr:GYTO (this work)0.939376
    Table 4. Comparison of the lifetimes of 5I7 and 5I6 in different crystals
    Yi He, Renqin Dou, Haotian Zhang, Wenpeng Liu, Qingli Zhang, Yingying Chen, Yuxi Gao, Jianqiao Luo. Growth, structure, and spectroscopic properties of Yb,Ho,Pr:GYTO single crystal (Invited)[J]. Infrared and Laser Engineering, 2020, 49(12): 20201067
    Download Citation