• Acta Optica Sinica
  • Vol. 39, Issue 11, 1106004 (2019)
li wei, zhuang liu*, hengchun li, and dazhou jiang
Author Affiliations
  • School of Mechanical and Electrical Engineering, Wuhan University of Technology, Wuhan Hubei 430070, China
  • show less
    DOI: 10.3788/AOS201939.1106004 Cite this Article Set citation alerts
    li wei, zhuang liu, hengchun li, dazhou jiang. Fiber Bragg Grating Vibration Sensor Based on Sensitive Structure for "士"-Shaped Beam[J]. Acta Optica Sinica, 2019, 39(11): 1106004 Copy Citation Text show less
    Diagram of FBG sensor structure
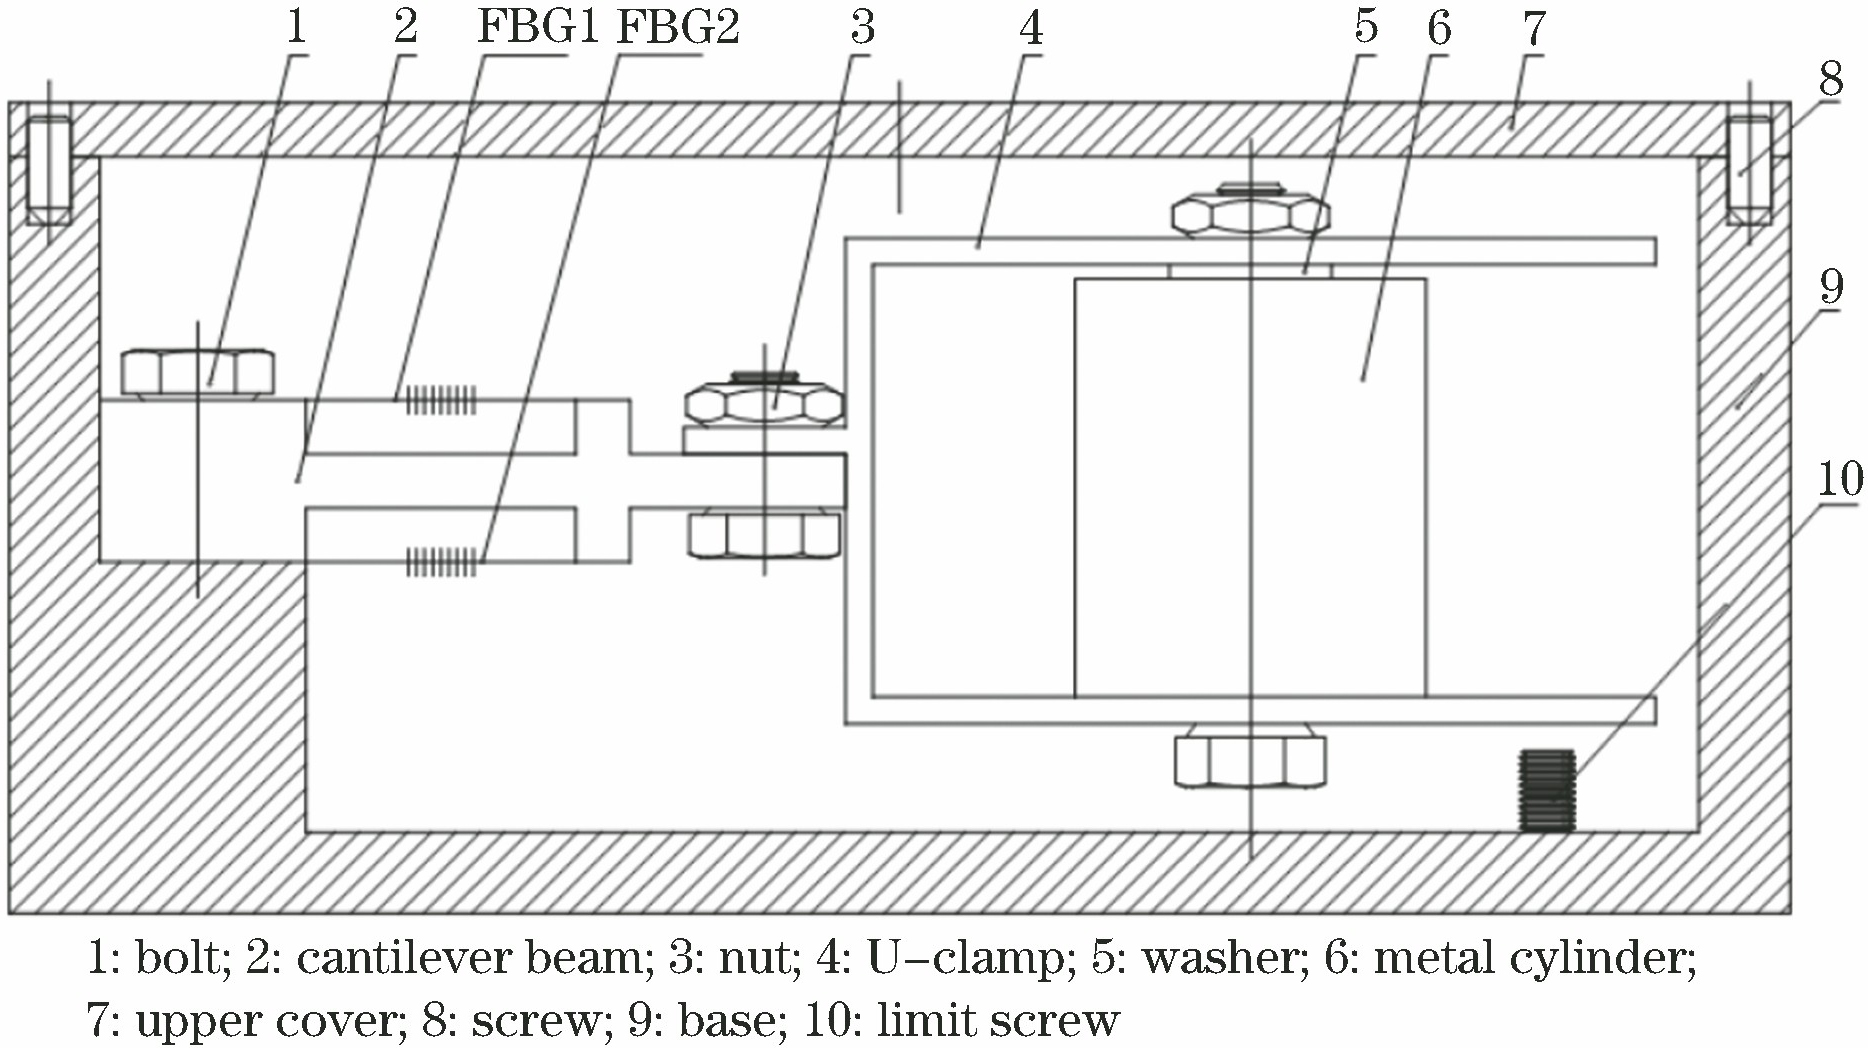
    Fig. 1. Diagram of FBG sensor structure
    Structure of mechanics model of sensor unit. (a) Top view; (b) front view
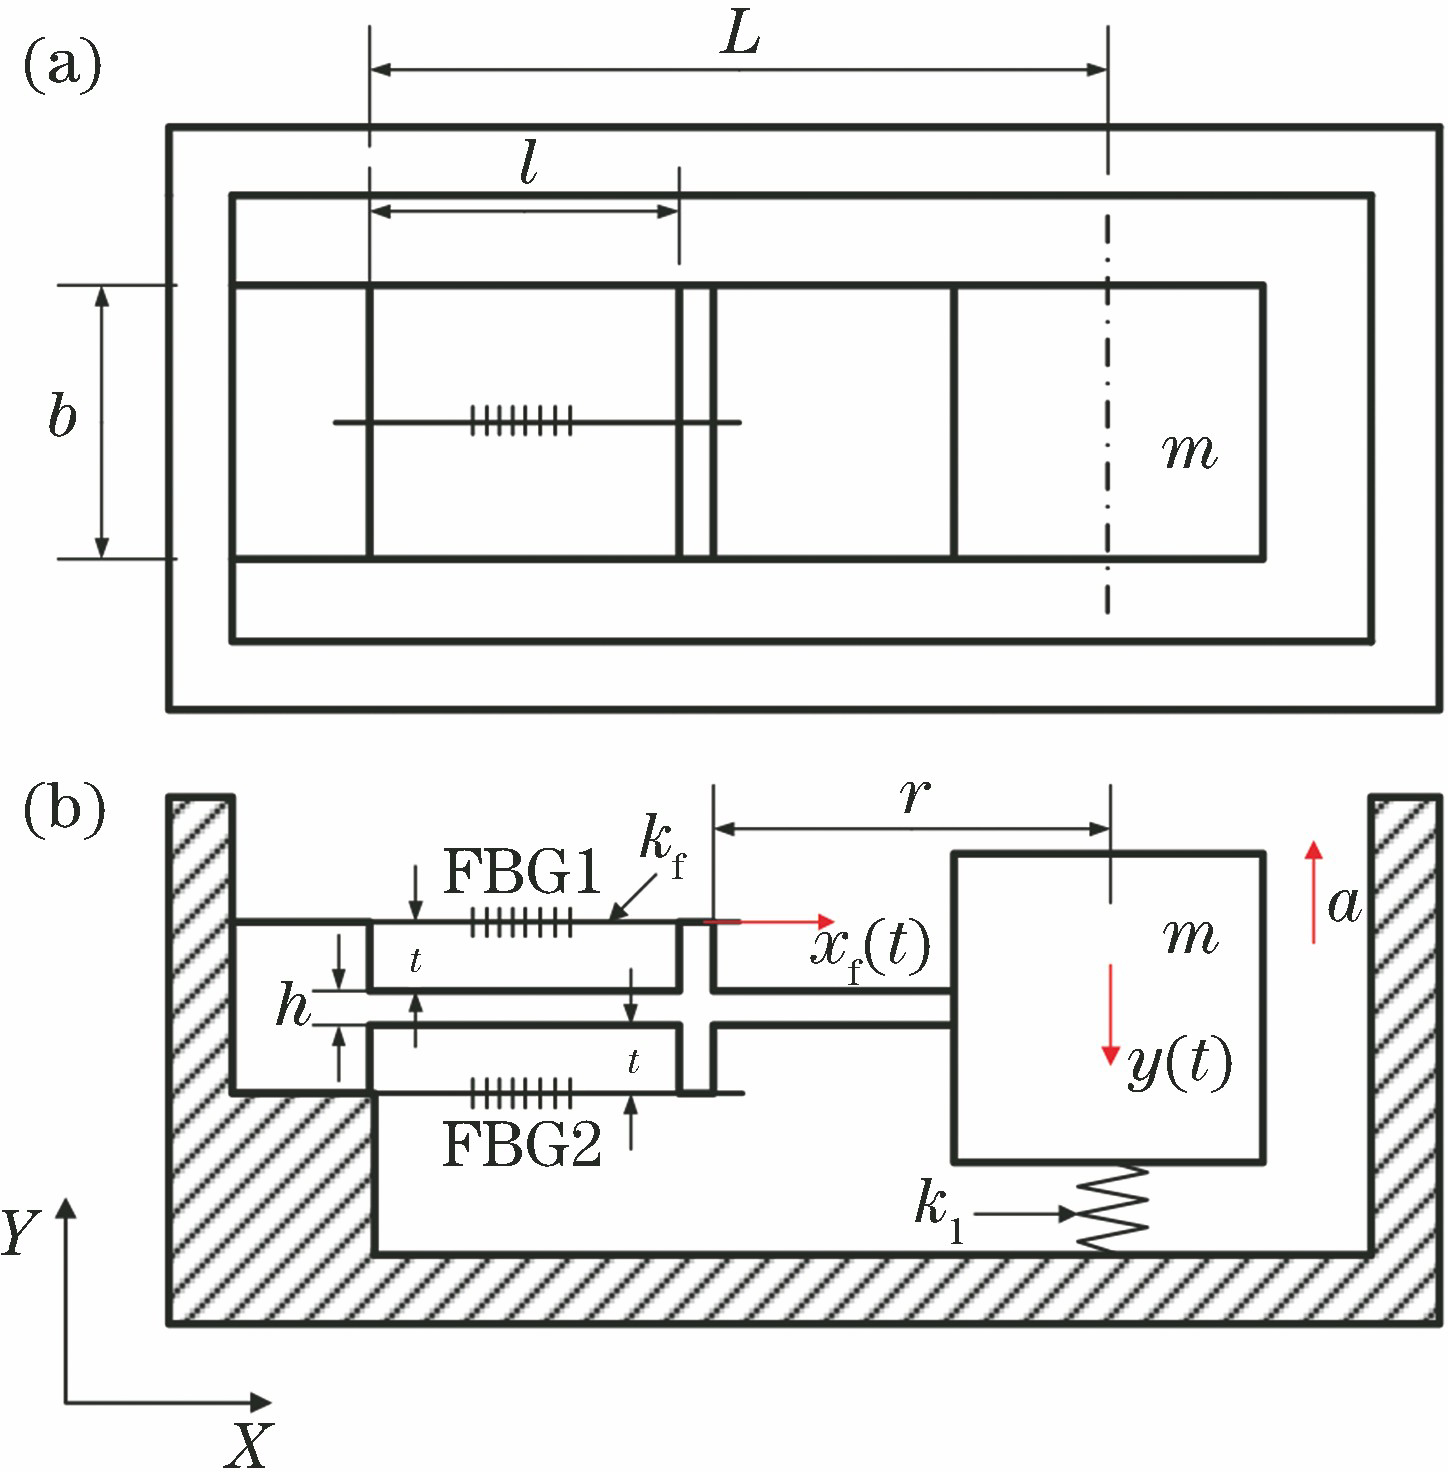
    Fig. 2. Structure of mechanics model of sensor unit. (a) Top view; (b) front view
    Force analysis of cantilever beam. (a) Axonometric drawing; (b) front view
    Fig. 3. Force analysis of cantilever beam. (a) Axonometric drawing; (b) front view
    Variations in S and f with L (λ=1550 mm, b=16 mm, h=2 mm, t=5 mm, m=40 g)
    Fig. 4. Variations in S and f with L (λ=1550 mm, b=16 mm, h=2 mm, t=5 mm, m=40 g)
    Variations in S and f with b (λ=1550 mm, L=30 mm, h=2 mm, t=5 mm, m=40 g)
    Fig. 5. Variations in S and f with b (λ=1550 mm, L=30 mm, h=2 mm, t=5 mm, m=40 g)
    Variations in S and f with h (λ=1550 mm, L=30 mm, b=16 mm, t=5 mm, m=40 g)
    Fig. 6. Variations in S and f with h (λ=1550 mm, L=30 mm, b=16 mm, t=5 mm, m=40 g)
    Variations in S and f with m (λ=1550 mm, L=30 mm, b=16 mm, h=2 mm, t=5 mm)
    Fig. 7. Variations in S and f with m (λ=1550 mm, L=30 mm, b=16 mm, h=2 mm, t=5 mm)
    First-order mode shape diagram of sensor 1
    Fig. 8. First-order mode shape diagram of sensor 1
    First-order mode shape diagram of sensor 2
    Fig. 9. First-order mode shape diagram of sensor 2
    Experimental system diagram of sensor
    Fig. 10. Experimental system diagram of sensor
    Amplitude-frequency response curves of sensor 1
    Fig. 11. Amplitude-frequency response curves of sensor 1
    Amplitude-frequency response curves of sensor 2
    Fig. 12. Amplitude-frequency response curves of sensor 2
    Time domain diagrams of two FBGs of sensor1 when frequency is 50 Hz and amplitude of excitation acceleration is 10 m·s-2. (a) FBG1; (b) FBG2
    Fig. 13. Time domain diagrams of two FBGs of sensor1 when frequency is 50 Hz and amplitude of excitation acceleration is 10 m·s-2. (a) FBG1; (b) FBG2
    Linearity curve of sensor 1
    Fig. 14. Linearity curve of sensor 1
    Linearity curve of sensor 2
    Fig. 15. Linearity curve of sensor 2
    Curve of cross-axis anti-interference characteristic of sensor 1
    Fig. 16. Curve of cross-axis anti-interference characteristic of sensor 1
    Curve of cross-axis anti-interference characteristic of sensor 2
    Fig. 17. Curve of cross-axis anti-interference characteristic of sensor 2
    ParameterValue
    Length of cantilever beam L /mm36(or 24)
    Optical fiber span l /mm10
    Width of cantilever beam b /mm16
    Height of cantilever beam h /mm2
    Height of platform t /mm5
    Quality of mass block m /g60(or 28)
    Grating wavelength λ /nm1550
    Young's modulus ofcantilever E /GPa210
    Young's modulus of optical fiber Ef /GPa72
    Cross section area of optical fiber Af /(10-8 m2)1.227
    Table 1. Structure and material parameters of FBG vibration sensor
    Frequency /Hz205080100200
    Sensitivityof sensor 1 /( pm·g-1)117.3120.1123.6
    Sensitivityof sensor 2 /(pm·g-1)32.032.634.1
    Table 2. Sensitivity of FBG vibration sensor under different excitation frequencies
    li wei, zhuang liu, hengchun li, dazhou jiang. Fiber Bragg Grating Vibration Sensor Based on Sensitive Structure for "士"-Shaped Beam[J]. Acta Optica Sinica, 2019, 39(11): 1106004
    Download Citation