Author Affiliations
1University of Science and Technology of China, Hefei 230026, Anhui, China2Key Laboratory of Environmental Optics and Technology, Anhui Institute of Optics and Fine Mechanics, Hefei Institutes of Physical Science, China Academy of Sciences, Hefei 230031, Anhui, China3Key Laboratory of Optical Monitoring Technology for Environment of Anhui Province, Hefei 230031, Anhui, China4Huainan Normal University, Huainan 232000, Anhui, Chinashow less
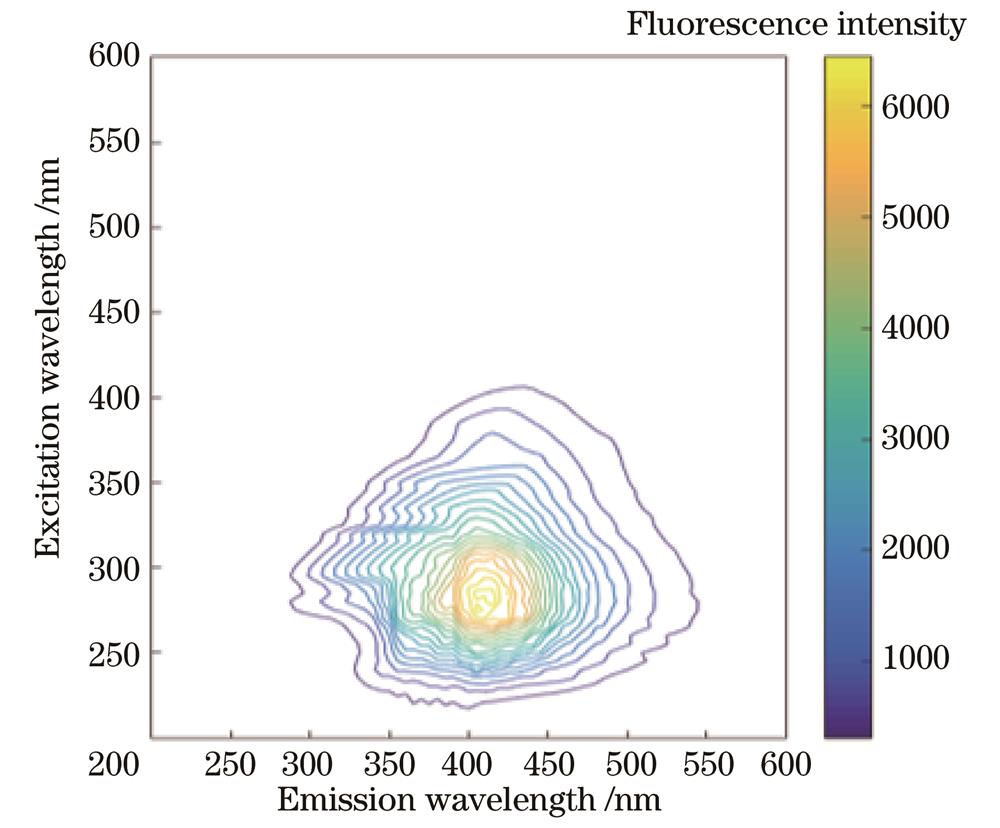
Fig. 1. Three-dimensional fluorescence spectra of diesel engine oil
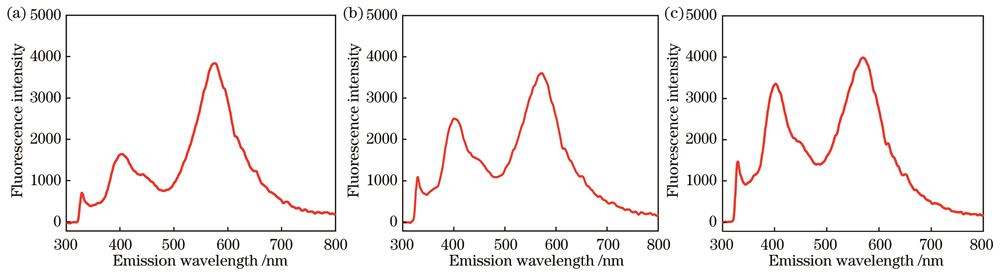
Fig. 2. Emission spectra of different soil blank samples under 280 nm-LED irradiation. (a) Red soil; (b) yellow soil; (c) black soil
Fig. 3. Emission spectra of samples containing 10% engine oil under different soil types irradiated by 280 nm-LED
Fig. 4. Schematic diagram and physical picture of experimental system. (a) Schematic diagram;(b) physical picture
Fig. 5. Correlation between mass fraction of oil in soil and fluorescent electrical signal. (a) LIF system; (b) experimental system
Fig. 6. Average RSD measured by proposed system under different soil types
Fig. 7. Average RE measured by proposed system under different soil types
| Integration time /s | RSD /% |
|---|
| 0.4 | 6.77 | | 0.6 | 5.56 | | 0.8 | 4.72 | | 1.0 | 4.57 | | 1.4 | 4.41 | | 1.6 | 4.23 | | 2.0 | 3.61 | | 2.2 | 3.67 | | 2.4 | 3.65 | | 2.6 | 3.61 | | 3.0 | 3.52 |
|
Table 1. RSD of signal of experimental system under different integration times
| Soil type | Petroleum hydrocarbon | Regression equation | Correlation coefficient R2 | Detection limit / (mg·kg-1) |
|---|
| Red soil | Gasoline engine oil | y=7121.3x+8803.12 | 0.9734 | 60.38 | | Diesel engine oil | y=14374.4x+8791.96 | 0.9941 | 29.91 | | Air compressor engine oil | y=49681.01x+8827.11 | 0.9953 | 8.66 | | Yellow soil | Gasoline engine oil | y=6915.7x+10724.4 | 0.9625 | 62.37 | | Diesel engine oil | y=13730.1x+11400.7 | 0.9937 | 31.39 | | Air compressor engine oil | y=48622.8x+11641.1 | 0.9964 | 8.87 | | Black soil | Gasoline engine oil | y=6001.63x+18761.29 | 0.9572 | 104.97 | | Diesel engine oil | y=12113.57x+18912.43 | 0.9901 | 52.01 | | Air compressor engine oil | y=37619.13x+18317.61 | 0.9926 | 16.75 |
|
Table 2. Quantitative analysis of soil petroleum hydrocarbons for different soil types
| Petroleum hydrocarbon | Standard mass fraction | Predicted mass fraction | RE | Average RE | RSD | Average RSD |
|---|
| Gasoline engine oil | 0.150 | 0.143 | 4.67 | 5.62 | 3.70 | 3.53 | | 0.250 | 0.233 | 6.80 | 3.71 | | 0.350 | 0.371 | 6.00 | 3.42 | | 0.600 | 0.579 | 3.50 | 3.49 | | 0.800 | 0.857 | 7.13 | 3.33 | | Diesel engine oil | 0.150 | 0.141 | 6.00 | 4.76 | 3.59 | 3.59 | | 0.250 | 0.257 | 2.80 | 3.61 | | 0.350 | 0.341 | 2.57 | 3.44 | | 0.600 | 0.613 | 2.17 | 4.17 | | 0.800 | 0.882 | 10.25 | 3.12 | | Air compressor engine oil | 0.150 | 0.155 | 3.33 | 4.40 | 3.36 | 3.36 | | 0.250 | 0.261 | 4.40 | 3.28 | | 0.350 | 0.357 | 2.00 | 3.51 | | 0.600 | 0.631 | 5.17 | 3.55 | | 0.800 | 0.859 | 7.38 | 3.12 |
|
Table 3. Prediction results of different types of petroleum hydrocarbons in red soil
| Petroleum hydrocarbon | Standard mass fraction | Predicted mass fraction | RE | Average RE | RSD | Average RSD |
|---|
| Gasoline engine oil | 0.150 | 0.134 | 10.67 | 7.69 | 3.17 | 3.70 | | 0.250 | 0.234 | 6.40 | 4.63 | | 0.350 | 0.329 | 6.00 | 3.76 | | 0.600 | 0.570 | 5.00 | 3.01 | | 0.800 | 0.883 | 10.38 | 3.92 | | Diesel engine oil | 0.150 | 0.137 | 8.67 | 6.31 | 2.42 | 3.16 | | 0.250 | 0.261 | 4.40 | 3.31 | | 0.350 | 0.332 | 5.14 | 3.86 | | 0.600 | 0.567 | 5.50 | 3.01 | | 0.800 | 0.863 | 7.88 | 3.19 | | Air compressor engine oil | 0.150 | 0.143 | 4.60 | 6.40 | 3.21 | 3.04 | | 0.250 | 0.232 | 7.20 | 2.01 | | 0.350 | 0.326 | 6.86 | 3.45 | | 0.600 | 0.626 | 4.33 | 3.12 | | 0.800 | 0.728 | 9.00 | 3.43 |
|
Table 4. Prediction results of different types of petroleum hydrocarbons in yellow soil
| Petroleum hydrocarbon | Standard mass fraction | Predicted mass fraction | RE | Average RE | RSD | Average RSD |
|---|
| Gasoline engine oil | 0.150 | 0.159 | 6.00 | 8.25 | 3.33 | 3.40 | | 0.250 | 0.270 | 8.00 | 3.71 | | 0.350 | 0.377 | 7.71 | 3.12 | | 0.600 | 0.672 | 12.00 | 3.29 | | 0.800 | 0.891 | 11.38 | 3.61 | | Diesel engine oil | 0.150 | 0.162 | 8.00 | 6.72 | 3.52 | 3.51 | | 0.250 | 0.263 | 5.20 | 3.90 | | 0.350 | 0.359 | 2.57 | 3.37 | | 0.600 | 0.663 | 10.50 | 3.21 | | 0.800 | 0.862 | 7.75 | 3.53 | | Air compressor engine oil | 0.150 | 0.138 | 7.33 | 7.24 | 3.53 | 3.01 | | 0.250 | 0.268 | 7.20 | 3.52 | | 0.350 | 0.369 | 5.43 | 3.23 | | 0.600 | 0.654 | 9.00 | 3.09 | | 0.800 | 0.853 | 6.62 | 2.19 |
|
Table 5. Prediction results of different types of petroleum hydrocarbons in black soil
| Petroleum hydrocarbon | Regression equation | Correlation coefficient R2 | Detection limit / (mg·kg-1) |
|---|
| Gasoline engine oil | y=4718.51x+46940.9 | 0.9515 | 135.65 | | Diesel engine oil | y=10781.53x+47113.3 | 0.9793 | 59.37 | | Air compressor engine oil | y=32629.52x+47467.6 | 0.9901 | 19.62 |
|
Table 6. Quantitative analysis of soil petroleum hydrocarbons in lake bottom mud
| Petroleum hydrocarbon | Standard mass fraction | Predicted mass fraction | RE | Average RE |
|---|
| Gasoline engine oil | 0.150 | 0.178 | 18.67 | 8.25 | | 0.250 | 0.275 | 10.00 | | 0.350 | 0.326 | 6.86 | | 0.600 | 0.565 | 5.83 | | 0.800 | 0.846 | 5.75 | | Diesel engine oil | 0.150 | 0.128 | 14.67 | 6.72 | | 0.250 | 0.236 | 5.60 | | 0.350 | 0.323 | 7.71 | | 0.600 | 0.571 | 4.83 | | 0.800 | 0.764 | 4.50 | | Air compressor engine oil | 0.150 | 0.163 | 8.69 | 7.24 | | 0.250 | 0.234 | 6.40 | | 0.350 | 0.329 | 6.00 | | 0.600 | 0.563 | 6.17 | | 0.800 | 0.773 | 8.63 |
|
Table 7. Prediction results of different types of petroleum hydrocarbons in lake bottom mud