
Yongqiang ZHANG. Using LiDAR-DEM based rapid flood inundation modelling framework to map floodplain inundation extent and depth[J]. Journal of Geographical Sciences, 2020, 30(10): 1649
- Journal of Geographical Sciences
- Vol. 30, Issue 10, 1649 (2020)
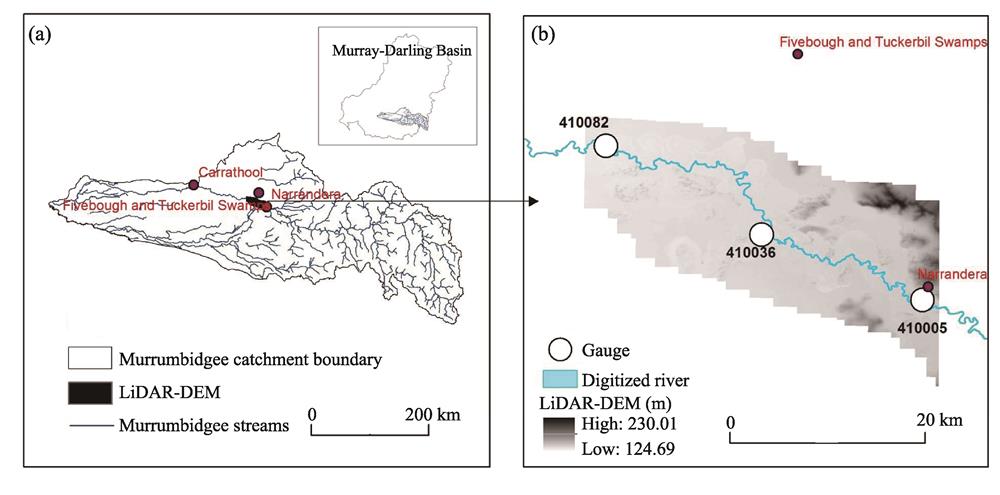
Fig. 1. Location of research area (a); spatial pattern of 2-m resolution LiDAR-DEM and locations of the three gauges (b)
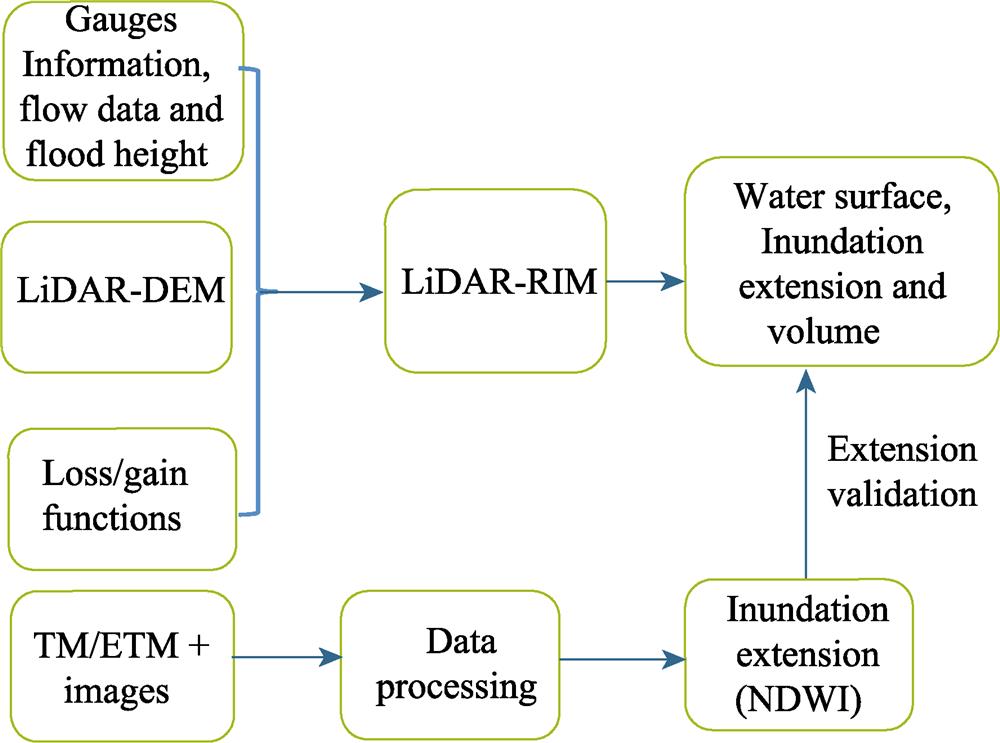
Fig. 2. Flowchart showing how the LiDAR - RIM framework works
Fig. 3. An example for estimating inundation depth from the 2 m LiDAR-DEM water surface to flood water surface at the gauge site 410005
Fig. 4. A schematic figure showing flood flow directions over the floodplain
Fig. 5. Unconstrained inundation depth mapping for March 2012 flood (a) and December 2010 flood (b)
Fig. 6. Water bodies (black) extent obtained using Landsat ETM+ images taken on March 20, 2012 (a) and January 5, 2011 (b), respectively (red polygons are the boundaries of actual inundation extent (see Figures 6c and 6f); inundation extents controlled by flood mass balance (b and d); inundation extents obtained by considering flood mass balance control together with infiltration and open water evaporation (c and f). (a)-(c) are for the March 2012 flood; (d) and (f) are for the December 2010 flood.
Fig. 7. Relationships between the river stage and inundation volume (a and c); relationships between river stage and inundation area obtained using different resolutions from 2 m to 40 m (b and d). The upper panels (a), (b) and (c) are for the March 2012 flood; the lower panels (b), (c) and (d) are for the December 2010 flood.
Fig. 8. Two cross-sections obtained along the Murrumbidgee River using 2-m and 30-m LiDAR-DEM and 30-m SRTM-DEM
Fig. 9. Inundation extents obtained using SRTM-DEM considering flood mass balance control for the March 2012 flood event (a) and the December 2010 flood events (b)
Fig. 10. Relationships between the river stage and inundation volume for reach 410005 to 410036 (a) and the reach 410036 to 410082 (b)
| |||||||||||||||||||||||||||||||||||||||||||
Table 1.
Inundation depth for the three gauging sites and for the two flood events. Maximum inundation depth is the difference between maximum river stage and the depth from zero gauge to the LiDAR-DEM water surface.


Set citation alerts for the article
Please enter your email address

© Copyright 2018-2021 | Chinese Laser Press. All Rights Reserved 沪ICP备15018463号-20