Author Affiliations
School of Material and Metallurgy, Inner Mongolia University of Science and Technology, Baotou, Inner Mongolia 014010, Chinashow less
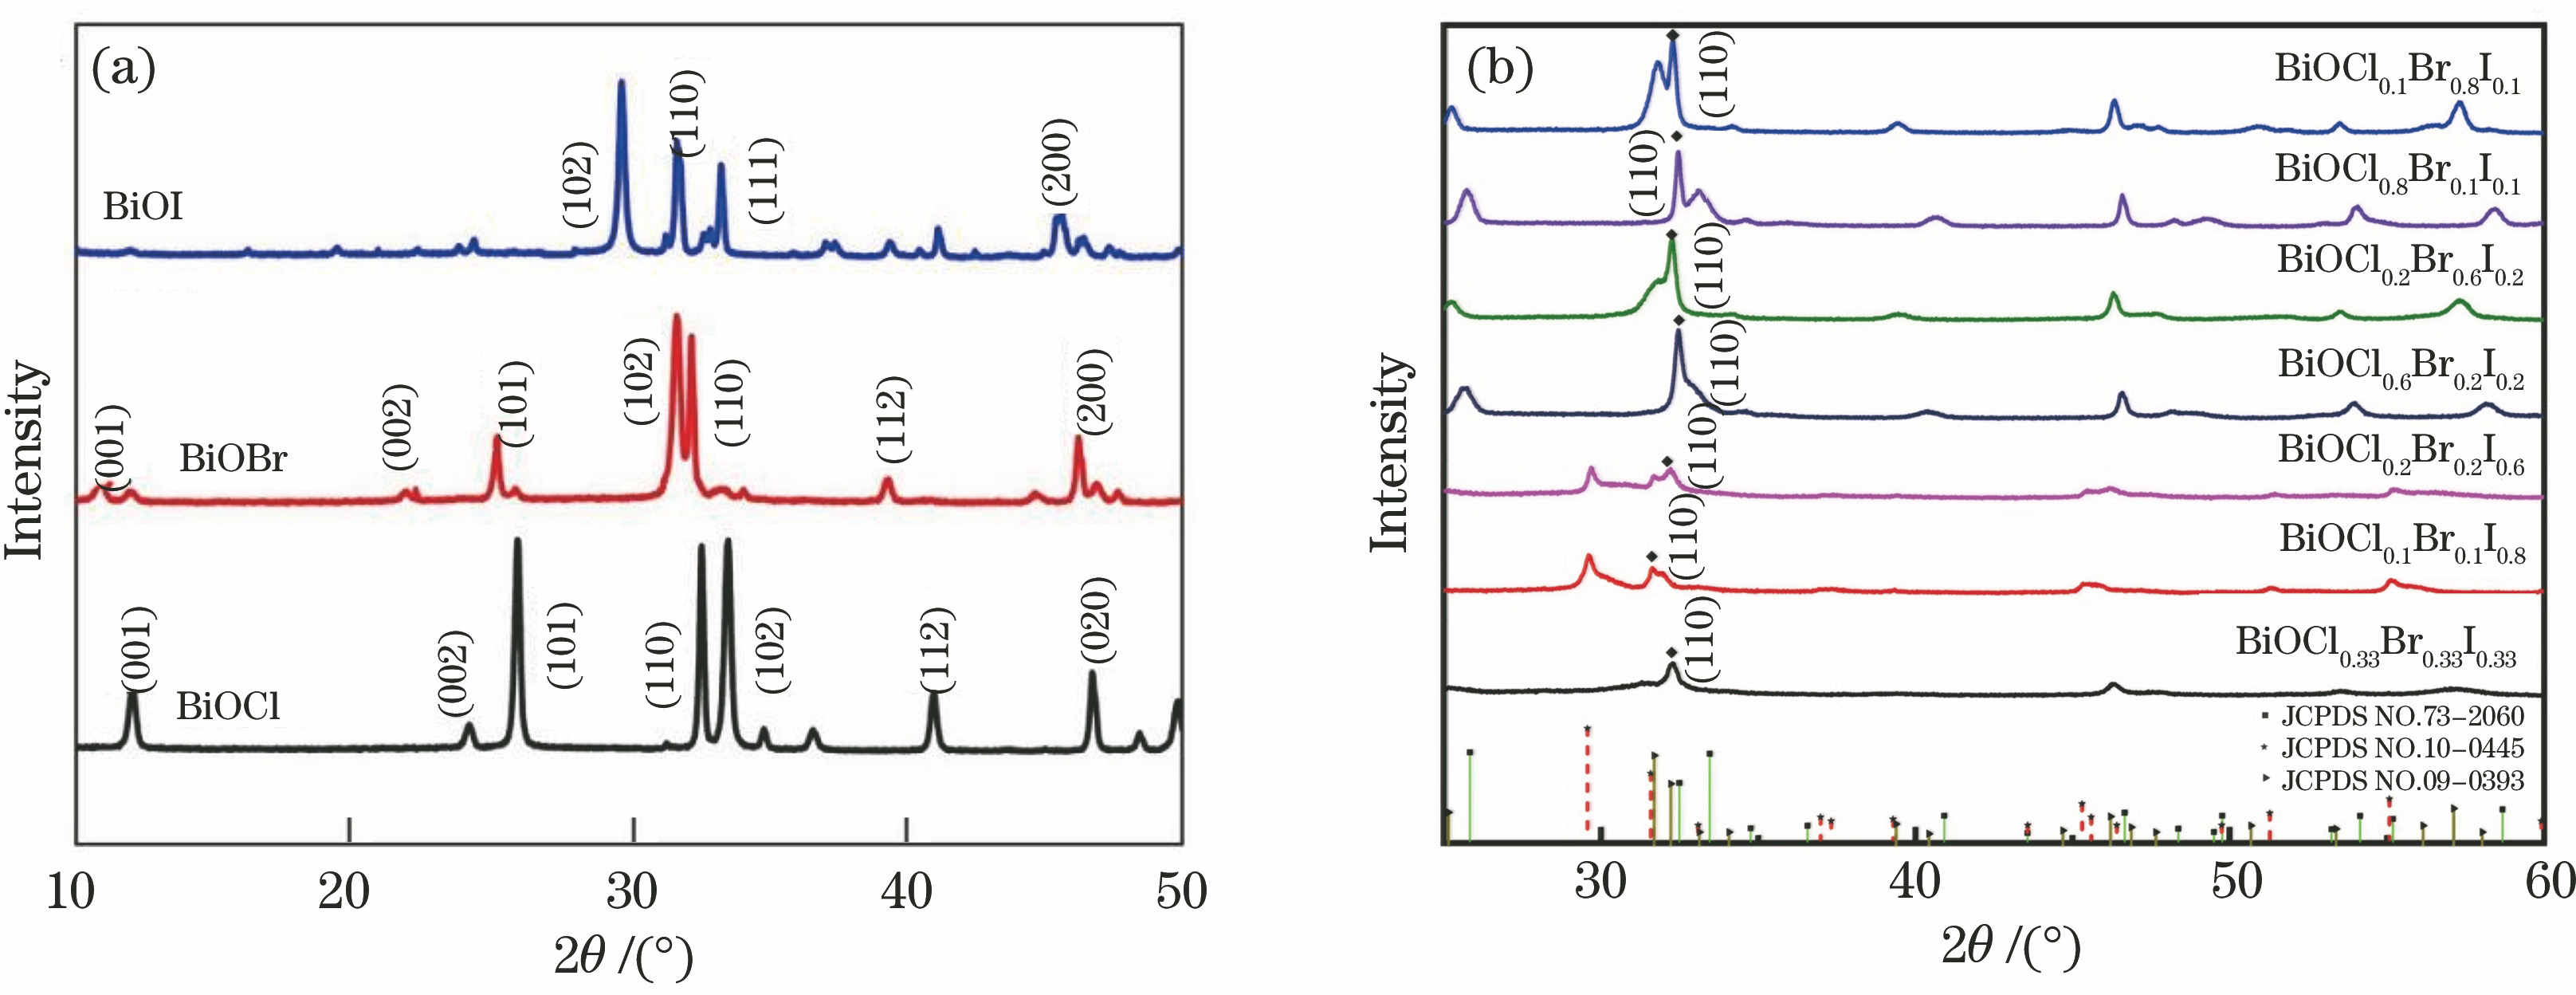
Fig. 1. XRD patterns of pure BiOX and BiOClxBryIz composite catalysts. (a) Pure BiOX; (b) BiOClxBryIz composite catalysts
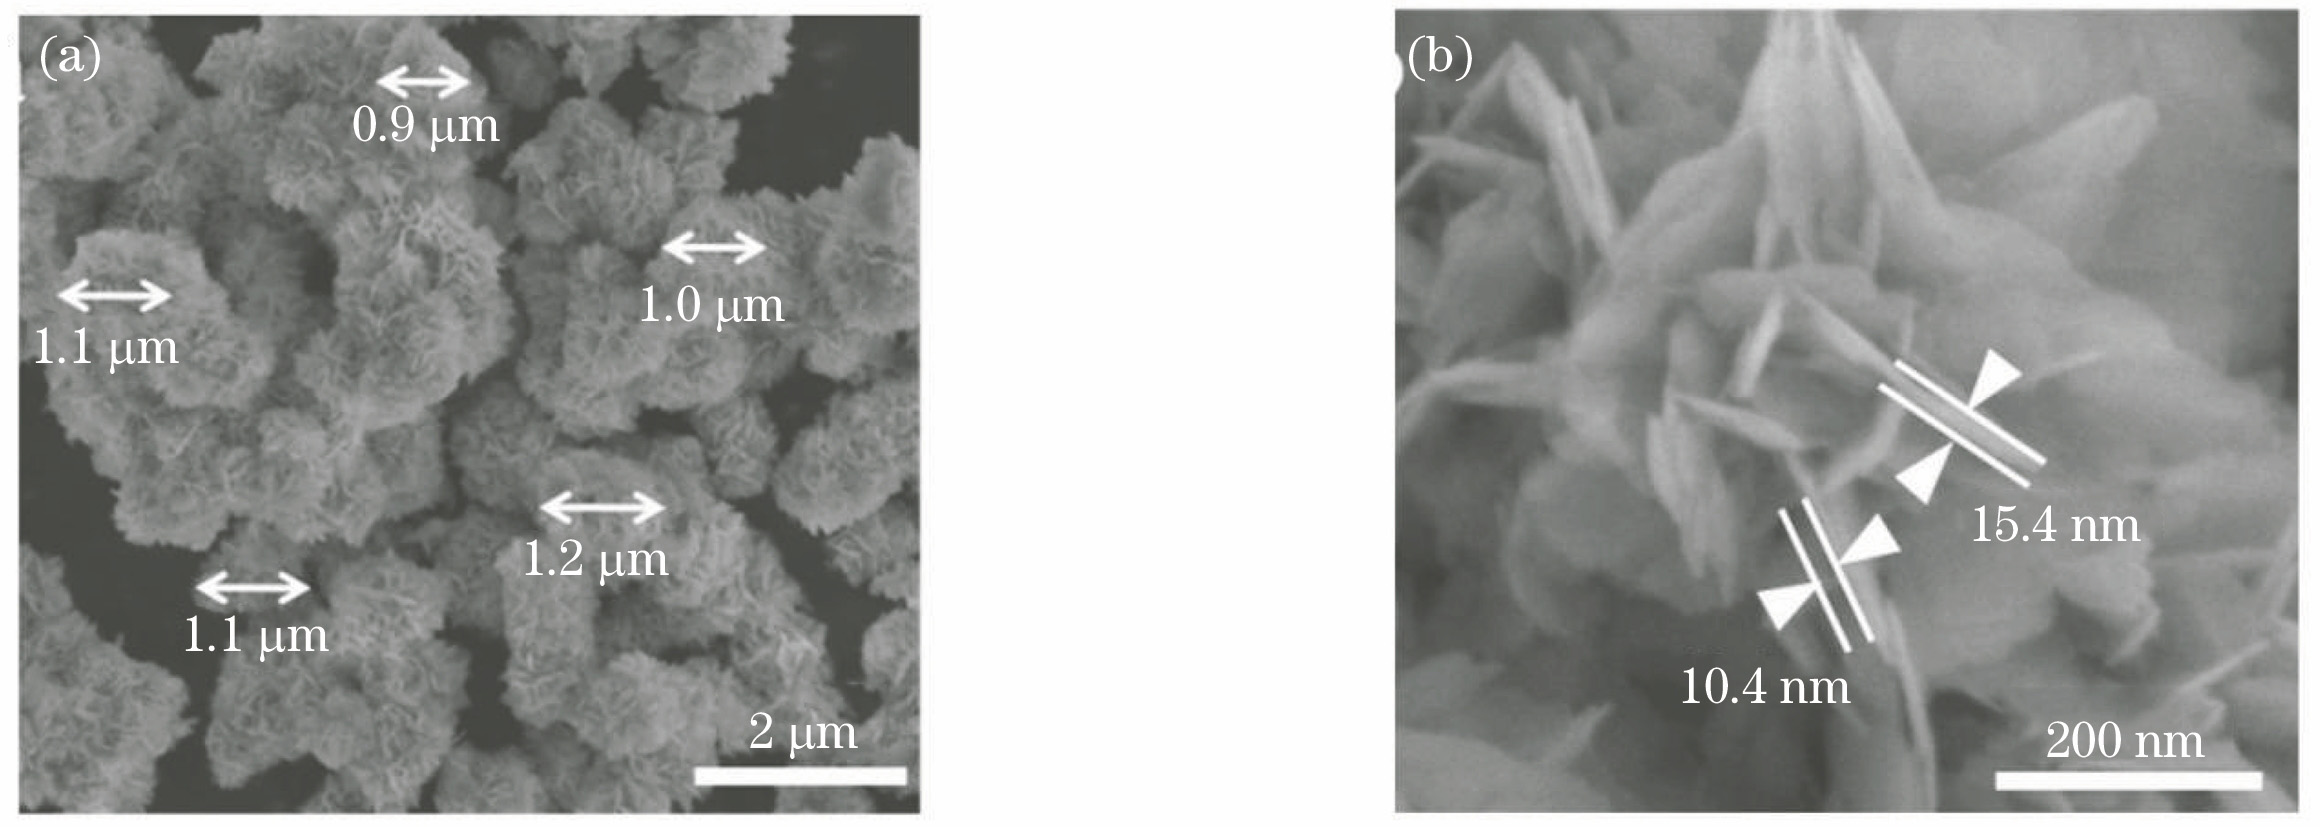
Fig. 2. SEM images of BiOCl0.33Br0.33I0.33 composite catalyst
Fig. 3. EDS spectrum and mapping images of BiOCl0.33Br0.33I0.33 catalyst. (a) SEM image; (b) EDS spectrum; (c)--(h) mapping images
Fig. 4. TEM images of BiOCl0.33Br0.33I0.33 catalyst
Fig. 5. XPS spectra of BiOCl0.33Br0.33I0.33 composite catalyst. (a) Survey spectrum; (b) Bi 4f; (c) O 1s; (d) Cl 2p; (e) Br 3d; (f) I 3d
Fig. 6. UV-Vis diffuse reflectance spectra and (αhν)1/2-hν diagrams (inside) of BiOClxBryIz composite catalysts
Fig. 7. PL spectra of BiOClxBryIz composite catalysts
Fig. 8. Efficiency graphs of BiOClxBryIz composite catalysts and pure BiOX degrading 15 mg/L MO
Fig. 9. Reaction kinetics diagrams of BiOClxBryIz composite catalysts degrading 15 mg/L MO
BiOClxBryIz | Dosage of NaCl /g | Dosage of NaBr /g | Dosage of NaI·2H2O /g |
---|
BiOCl0.1Br0.1I0.8 | 0.0351 | 0.0617 | 0.8924 | BiOCl0.1Br0.8I0.1 | 0.0351 | 0.4939 | 0.1116 | BiOCl0.2Br0.2I0.6 | 0.0702 | 0.1235 | 0.6693 | BiOCl0.2Br0.6I0.2 | 0.0702 | 0.3704 | 0.2231 | BiOCl0.33Br0.33I0.33 | 0.1157 | 0.2037 | 0.3681 | BiOCl0.6Br0.2I0.2 | 0.2104 | 0.1235 | 0.2231 | BiOCl0.8Br0.1I0.1 | 0.2805 | 0.0617 | 0.1116 |
|
Table 1. Dosage table of NaX in the preparation of BiOClxBryIz catalysts
Element | Bi | C | Br | I | O | Cl |
---|
Mass fraction /% | 61.57 | 10.07 | 9.71 | 9.13 | 4.83 | 4.68 | Atomic fraction /% | 16.73 | 47.62 | 6.90 | 4.09 | 17.15 | 7.50 |
|
Table 2. EDS analysis of each element in BiOCl0.33Br0.33I0.33 composite catalyst
BiOClxBryIz | Band gapEg /eV | Degradationefficiencyη /% | Kineticconstant k /(10-2 min-1) |
---|
BiOCl0.33Br0.33I0.33 | 1.83 | 98.4 | 2.160 | BiOCl0.2Br0.6I0.2 | 2.06 | 96.2 | 1.820 | BiOCl0.2Br0.2I0.6 | 1.70 | 90.5 | 1.310 | BiOCl0.1Br0.1I0.8 | 1.65 | 82.0 | 0.931 | BiOCl0.6Br0.2I0.2 | 2.13 | 70.1 | 0.654 | BiOCl0.8Br0.1I0.1 | 2.36 | 43.0 | 0.318 |
|
Table 3. Band gaps, degradation efficiencies and kinetic constants of BiOClxBryIz composite catalysts
Catalyst and its mass | Contaminant and itsmass concentration | Light source | Degradationefficiency | αTOF /(g·g-1·min-1) | Ref. |
---|
BiOI (0.100 g) | MO (10 mg·L-1) | 500 W Xe lamp(λ>420 nm) | 360(95) | 0.006 | [11] | BiOCl0.5Br0.5 (0.050 g) | MO (20 mg·L-1) | 300 W Xe lamp (λ>400 nm) | 70(100) | 0.022 | [12] | BiOBr0.4I0.6 (1.000 g) | MO (20 mg·L-1) | 500 W Xe lamp (λ>400 nm) | 90(92.6) | 0.021 | [13] | BiOCl0.75I0.25 (0.200 g) | MO (20 mg·L-1) | 500 W Xe lamp (λ>420 nm) | 50(100) | 0.020 | [15] | BiOCl0.5I0.5 (0.020 g) | MO (15 mg·L-1) | 300 W Xe lamp (λ>400 nm) | 180(83.0) | 0.035 | [21] | Er3+-Bi5O7I (0.04 g) | MO (10 mg·L-1) | 5 W LED lamp | 90(70) | 0.0077 | [22] | BiOCl0.33Br0.33I0.33 (0.020 g) | MO (15 mg·L-1) | 300 W Xe lamp (λ>400 nm) | 180(98.4) | 0.041 | This work | Note:αTOF=×100%, where C represents the original concentration of the simulated pollutant methyl orange, V represents the volume of the methyl orange solution, η represents the degradation efficiency of the methyl orange by the catalyst, m represents the quality of the catalyst, and t represents the duration of light. | |
|
Table 4. Photocatalytic activity of different BiOXs catalysts