• Spectroscopy and Spectral Analysis
  • Vol. 41, Issue 10, 3014 (2021)
Jin-ping OU1、*, Hao-ran LIU1、1; *;, Peng-cheng ZHU1、1;, Heng XU1、1;, Zhuang WANG2、2;, Yuan TIAN1、1;, Guo-hua LIU1、1;, and Qi-hua LI1、1;
Author Affiliations
  • 11. Institute of Physical Science and Information Technology, Anhui University, Hefei 230601, China
  • 22. Key Lab of Environmental Optics and Technology, Anhui Institute of Optics and Fine Mechanics, Hefei Institutes of Physical Science, Chinese Academy of Sciences, Hefei 230031, China
  • show less
    DOI: 10.3964/j.issn.1000-0593(2021)10-3014-07 Cite this Article
    Jin-ping OU, Hao-ran LIU, Peng-cheng ZHU, Heng XU, Zhuang WANG, Yuan TIAN, Guo-hua LIU, Qi-hua LI. Characteristics of Aerosol Optical Properties and Their Potential Source in Hefei in Autumn[J]. Spectroscopy and Spectral Analysis, 2021, 41(10): 3014 Copy Citation Text show less
    Location map of observation points
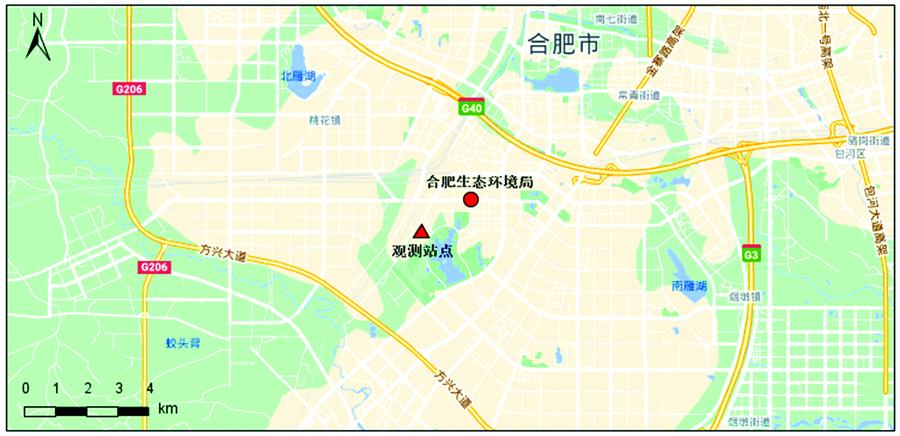
    Fig. 1. Location map of observation points
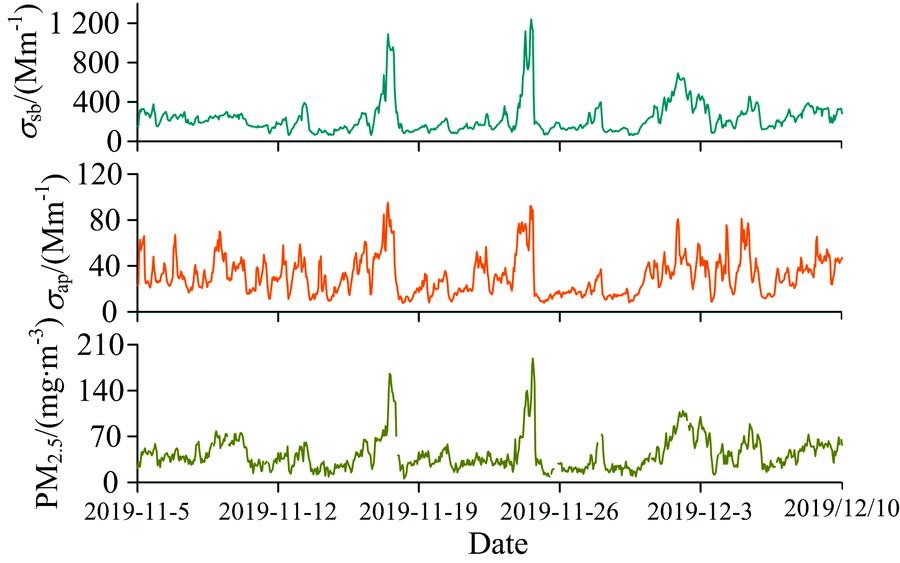
    The variation tendencies of σsp, σap and PM2.5 in Hefei during the research period
    Fig. 2. The variation tendencies of σsp, σap and PM2.5 in Hefei during the research period
    Average diurnal cycles of PM2.5 mass concentration, absorption coefficient (σap), scattering coefficient (σsp) and SSA
    Fig. 3. Average diurnal cycles of PM2.5 mass concentration, absorption coefficient (σap), scattering coefficient (σsp) and SSA
    Diurnal variations of temperature (T), relative humidity (RH), and wind speed (WS)
    Fig. 4. Diurnal variations of temperature (T), relative humidity (RH), and wind speed (WS)
    Wind speed and direction dependence maps of PM2.5 mass concentration, absorption coefficient (σap), scattering coefficient (σsp) and SSA
    Fig. 5. Wind speed and direction dependence maps of PM2.5 mass concentration, absorption coefficient (σap), scattering coefficient (σsp) and SSA
    Analysis of backward trajectory distributions (a), PSCF (b) and CWT (c) in Hefei
    Fig. 6. Analysis of backward trajectory distributions (a), PSCF (b) and CWT (c) in Hefei
    地点时间σsp/Mm-1σap/Mm-1SSA文献
    南京2016年1月454.68.70±238.7164.19±35.280.87±0.03[1]
    广州2014年2月—3月149.33±89.7345.67±30.390.80±0.06[6]
    北京2009年5月—2010年6月360±40564±620.82±0.09[10]
    天津2011年4月—5月369.9336.320.91[11]
    上海2010年12月—2011年3月292.81±206.3965.81±46.80.81±0.04[12]
    合肥2019年11月—12月238.70±161.5232.04±17.010.87±0.04本文
    Table 1. The comparison of scattering coefficient (σsp), absorption coefficient (σap) and single scattering albedo (SSA) of aerosol in different regions
    ClusterNumberMean±SD/(μg·m-3)Ratio/%
    1268367.51±280.6431.90
    2121524.19±309.3312.74
    3225422.50 ±248.0725.60
    4109464.39±122.7712.98
    563384.67±71.827.50
    678536.49±170.319.29
    Table 2. Trace number and average scattering coefficient content of each air mass in Hefei at 500 m
    Jin-ping OU, Hao-ran LIU, Peng-cheng ZHU, Heng XU, Zhuang WANG, Yuan TIAN, Guo-hua LIU, Qi-hua LI. Characteristics of Aerosol Optical Properties and Their Potential Source in Hefei in Autumn[J]. Spectroscopy and Spectral Analysis, 2021, 41(10): 3014
    Download Citation