• Spectroscopy and Spectral Analysis
  • Vol. 42, Issue 11, 3575 (2022)
Hai-kuan FENG1、*, Hui-lin TAO1、1;, Yu ZHAO1、1;, Fu-qin YANG3、3;, Yi-guang FAN1、1;, and Gui-jun YANG1、1; *;
Author Affiliations
  • 11. Key Laboratory of Quantitative Remote Sensing in Agriculture of Ministry of Agriculture and Rural Affairs, Information Technology Research Center, Beijing Academy of Agriculture and Forestry Sciences, Beijing 100097, China
  • 33. College of Civil Engineering, Henan University of Engineering, Zhengzhou 451191, China
  • show less
    DOI: 10.3964/j.issn.1000-0593(2022)11-3575-06 Cite this Article
    Hai-kuan FENG, Hui-lin TAO, Yu ZHAO, Fu-qin YANG, Yi-guang FAN, Gui-jun YANG. Estimation of Chlorophyll Content in Winter Wheat Based on UAV Hyperspectral[J]. Spectroscopy and Spectral Analysis, 2022, 42(11): 3575 Copy Citation Text show less
    Test area location and design
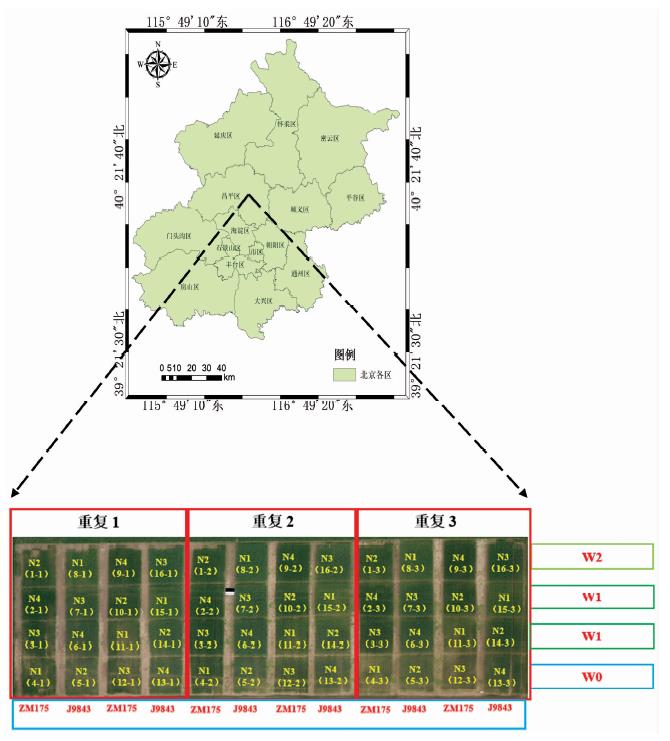
    Fig. 1. Test area location and design
    Model validation results in estimation of SPAD based on vegetation indices
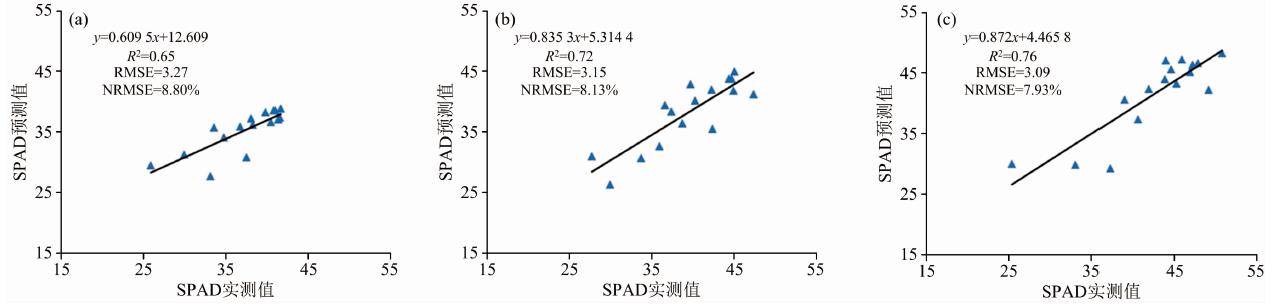
    Fig. 2. Model validation results in estimation of SPAD based on vegetation indices
    Model validation results in estimation of SPAD based on vegetation indices combined with red edge parameters
    Fig. 3. Model validation results in estimation of SPAD based on vegetation indices combined with red edge parameters
    Spatial distribution of SPAD in three growth stages
    Fig. 4. Spatial distribution of SPAD in three growth stages
    光谱
    参数
    公式参考
    文献
    LCI(R850-R710)/(R850+R670)1/2[10]
    PBIR810/R560[10]
    NDVI(R800-R680)/(R800+R680)[10]
    SRR750/R550[10]
    TCARI3×[(R700-R670)-0.2×(R700-R550)(R700/R670)][10]
    OSAVI1.16×(R800-R670)/(R800+R670+0.16)[10]
    GNDVI(R801-R550)/(R801+R550)[11]
    Table 1. Selected vegetation indices in this study
    参数相关系数
    拔节期挑旗期开花期
    LCI0.745**0.598**0.525**
    PBI0.718**0.553**0.502**
    NDVI0.701**0.530**0.441**
    SR0.670**0.494**0.404**
    TCARI-0.085-0.384**-0.204
    OSAVI0.655**0.514**0.439**
    GNDVI0.744**0.589**0.539**
    Dr0.521**0.443**0.436**
    SDr0.269*0.410**0.390**
    Drmin-0.445**-0.548**-0.370**
    Dr/Drmin0.696**0.626**0.428**
    Table 2. Correlation coefficients between vegetation indices, red edge parameters and SPAD
    生育期参数R2RMSENRMSE/%
    拔节期LCI0.562.968.14
    PBI0.513.098.50
    NDVI0.493.168.70
    GNDVI0.552.968.15
    Dr0.273.7810.41
    Dr/Drmin0.493.188.76
    挑旗期LCI0.364.0910.18
    PBI0.314.2510.59
    NDVI0.284.3310.78
    GNDVI0.354.1310.27
    Dr0.204.5811.39
    Dr/Drmin0.393.989.91
    开花期LCI0.284.6110.43
    PBI0.254.6810.60
    NDVI0.194.8611.00
    GNDVI0.294.5610.32
    Dr0.194.8711.03
    Dr/Drmin0.184.8911.08
    Table 3. Modelling results with single-parameter
    生育期建模集验证集
    R2RMSENRMSE/%R2RMSENRMSE/%
    拔节期0.622.677.430.653.278.80
    挑旗期0.702.536.570.723.158.13
    开花期0.732.495.570.763.097.93
    Table 4. Estimation of SPAD based on vegetation indices
    生育期建模集验证集
    R2RMSENRMSE/%R2RMSENRMSE/%
    拔节期0.642.617.270.683.178.53
    挑旗期0.712.506.440.743.118.05
    开花期0.782.224.950.813.027.62
    Table 5. Estimation of SPAD based on vegetation indices combined with red edge parameters
    Hai-kuan FENG, Hui-lin TAO, Yu ZHAO, Fu-qin YANG, Yi-guang FAN, Gui-jun YANG. Estimation of Chlorophyll Content in Winter Wheat Based on UAV Hyperspectral[J]. Spectroscopy and Spectral Analysis, 2022, 42(11): 3575
    Download Citation