• Laser & Optoelectronics Progress
  • Vol. 60, Issue 7, 0730002 (2023)
Mengqin Huang1, Shujia Wu1, Mingyin Yao1、2, Zihao Liu1, Chongjiu Wu1, Long Xue1、2, Muhua Liu1、2, and Jing Li1、2、*
Author Affiliations
  • 1School of Engineering, Jiangxi Agricultural University, Nanchang 330045, Jiangxi, China
  • 2Jiangxi Key Laboratory of Modern Agricultural Equipment, Nanchang 330045, Jiangxi, China
  • show less
    DOI: 10.3788/LOP213301 Cite this Article Set citation alerts
    Mengqin Huang, Shujia Wu, Mingyin Yao, Zihao Liu, Chongjiu Wu, Long Xue, Muhua Liu, Jing Li. Improving Detection Accuracy of Laser-Induced Breakdown Spectroscopy for Cu Element in Pig Feed Based on Spatial Confinement[J]. Laser & Optoelectronics Progress, 2023, 60(7): 0730002 Copy Citation Text show less
    Schematic diagram of CC-LIBS system
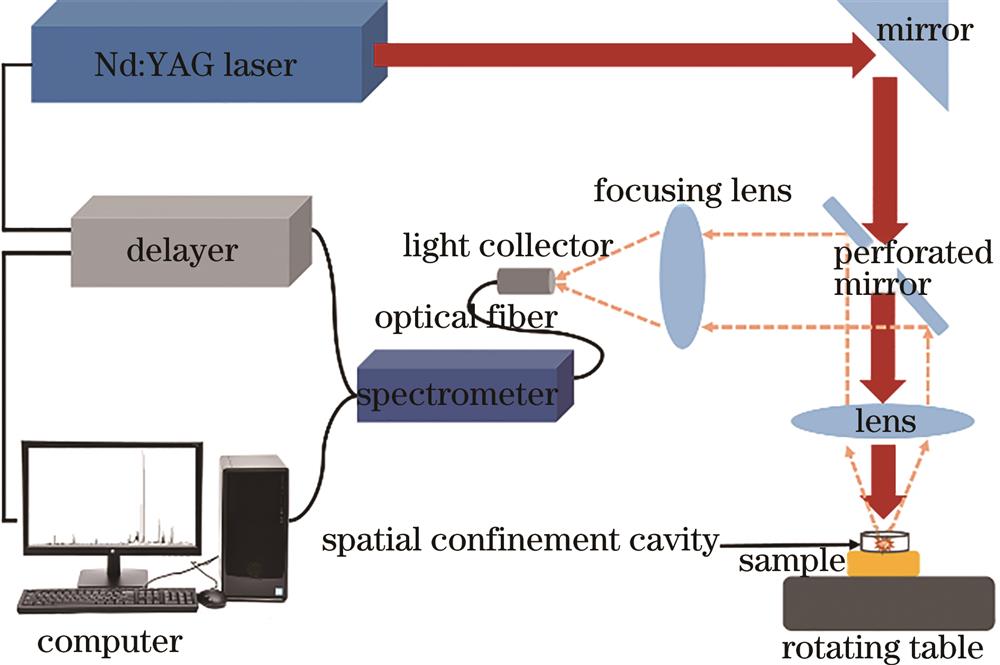
    Fig. 1. Schematic diagram of CC-LIBS system
    LIBS diagram from 324.301 to 328.421 nm of 60 # sample
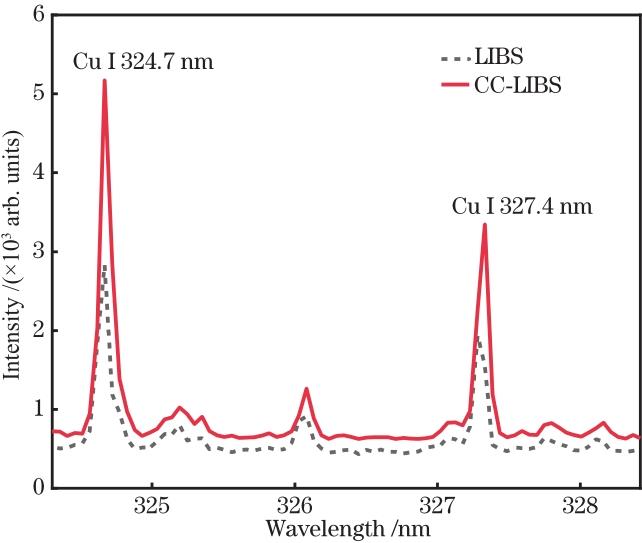
    Fig. 2. LIBS diagram from 324.301 to 328.421 nm of 60 # sample
    Spectral intensity of Cu element changing with concentration under two LIBS conditions. (a) LIBS; (b) CC-LIBS
    Fig. 3. Spectral intensity of Cu element changing with concentration under two LIBS conditions. (a) LIBS; (b) CC-LIBS
    SampleReference concentration /(mg·kg-1SampleReference concentration /(mg·kg-1SampleReference concentration /(mg·kg-1SampleReference concentration /(mg·kg-1
    01#53.9±0.0616#60.8±0.0431#133.9±0.1346#224.7±0.14
    02#53.9±0.0517#61.4±0.0332#133.2±0.0247#219.0±0.25
    03#53.6±0.0618#61.1±0.0733#133.2±0.0348#210.9±0.17
    04#39.2±0.1319#80.8±0.0134#153.5±0.1949#265.0±0.22
    05#39.2±0.0720#80.2±0.0435#153.2±0.2850#265.6±0.22
    06#40.2±0.1121#78.9±0.0836#153.5±0.2151#268.7±0.11
    07#35.2±0.0722#96.2±0.0537#172.0±0.3152#289.0±0.10
    08#32.7±0.0823#95.9±0.1338#173.5±0.3753#288.4±0.13
    09#32.0±0.0724#95.3±0.1739#174.5±0.1254#286.5±0.08
    10#41.1±0.0225#107.8±0.0540#185.1±0.0955#305.7±0.15
    11#41.1±0.0226#107.4±0.2041#183.9±0.1456#302.2±0.26
    12#41.4±0.0427#108.7±0.1842#182.9±0.0357#297.9±0.33
    13#40.1±0.0528#108.8±0.1243#167.6±0.0558#293.3±0.37
    14#39.8±0.0329#106.0±0.1244#168.9±0.0559#301.4±1.19
    15#40.1±0.0530#103.5±0.0545#167.6±0.1760#297.3±0.23
    Table 1. Actual content of Cu element in pig feed samples
    Pretreatment methodWithout confinementWith confinement
    RRMSEPRRMSEP
    SNV0.909941.80.986816.5
    MSC0.868449.30.988114.4
    Center0.951528.40.967625.3
    FD0.930832.90.973224.7
    SD0.943130.00.982619.0
    Table 2. Prediction results of PLS models for five pretreatment methods with and without spatial confinement
    SampleReference concentration /(mg·kg-1Without confinementWith confinement
    Predicted concentration /(mg·kg-1Relative error /%Predicted concentration /(mg·kg-1Relative error /%
    3#35.150-3.594110.2245.32128.94
    7#40.14627.31931.9550.02924.62
    11#41.07559.29644.3649.40820.29
    15#53.907-21.063139.0749.2688.61
    19#78.937112.95743.1089.77713.73
    23#95.912126.80832.2184.71511.67
    27#107.446163.67752.33122.78814.28
    31#133.200196.73447.70155.13416.47
    35#153.535214.08839.44157.9892.90
    39#168.866240.75942.57183.3338.57
    43#182.927206.15512.70161.79711.55
    47#219.028262.54719.87240.8019.94
    51#268.743276.0952.74249.8877.02
    55#293.271250.60114.55307.0804.71
    59#302.249222.26026.46289.1094.35
    Table 3. Prediction results of Cu element in MSC pretreatment model
    Mengqin Huang, Shujia Wu, Mingyin Yao, Zihao Liu, Chongjiu Wu, Long Xue, Muhua Liu, Jing Li. Improving Detection Accuracy of Laser-Induced Breakdown Spectroscopy for Cu Element in Pig Feed Based on Spatial Confinement[J]. Laser & Optoelectronics Progress, 2023, 60(7): 0730002
    Download Citation