
Ying Tong, Huicheng Yang. Traffic Sign Recognition Based on Improved Neural Networks[J]. Laser & Optoelectronics Progress, 2019, 56(19): 191002
- Laser & Optoelectronics Progress
- Vol. 56, Issue 19, 191002 (2019)
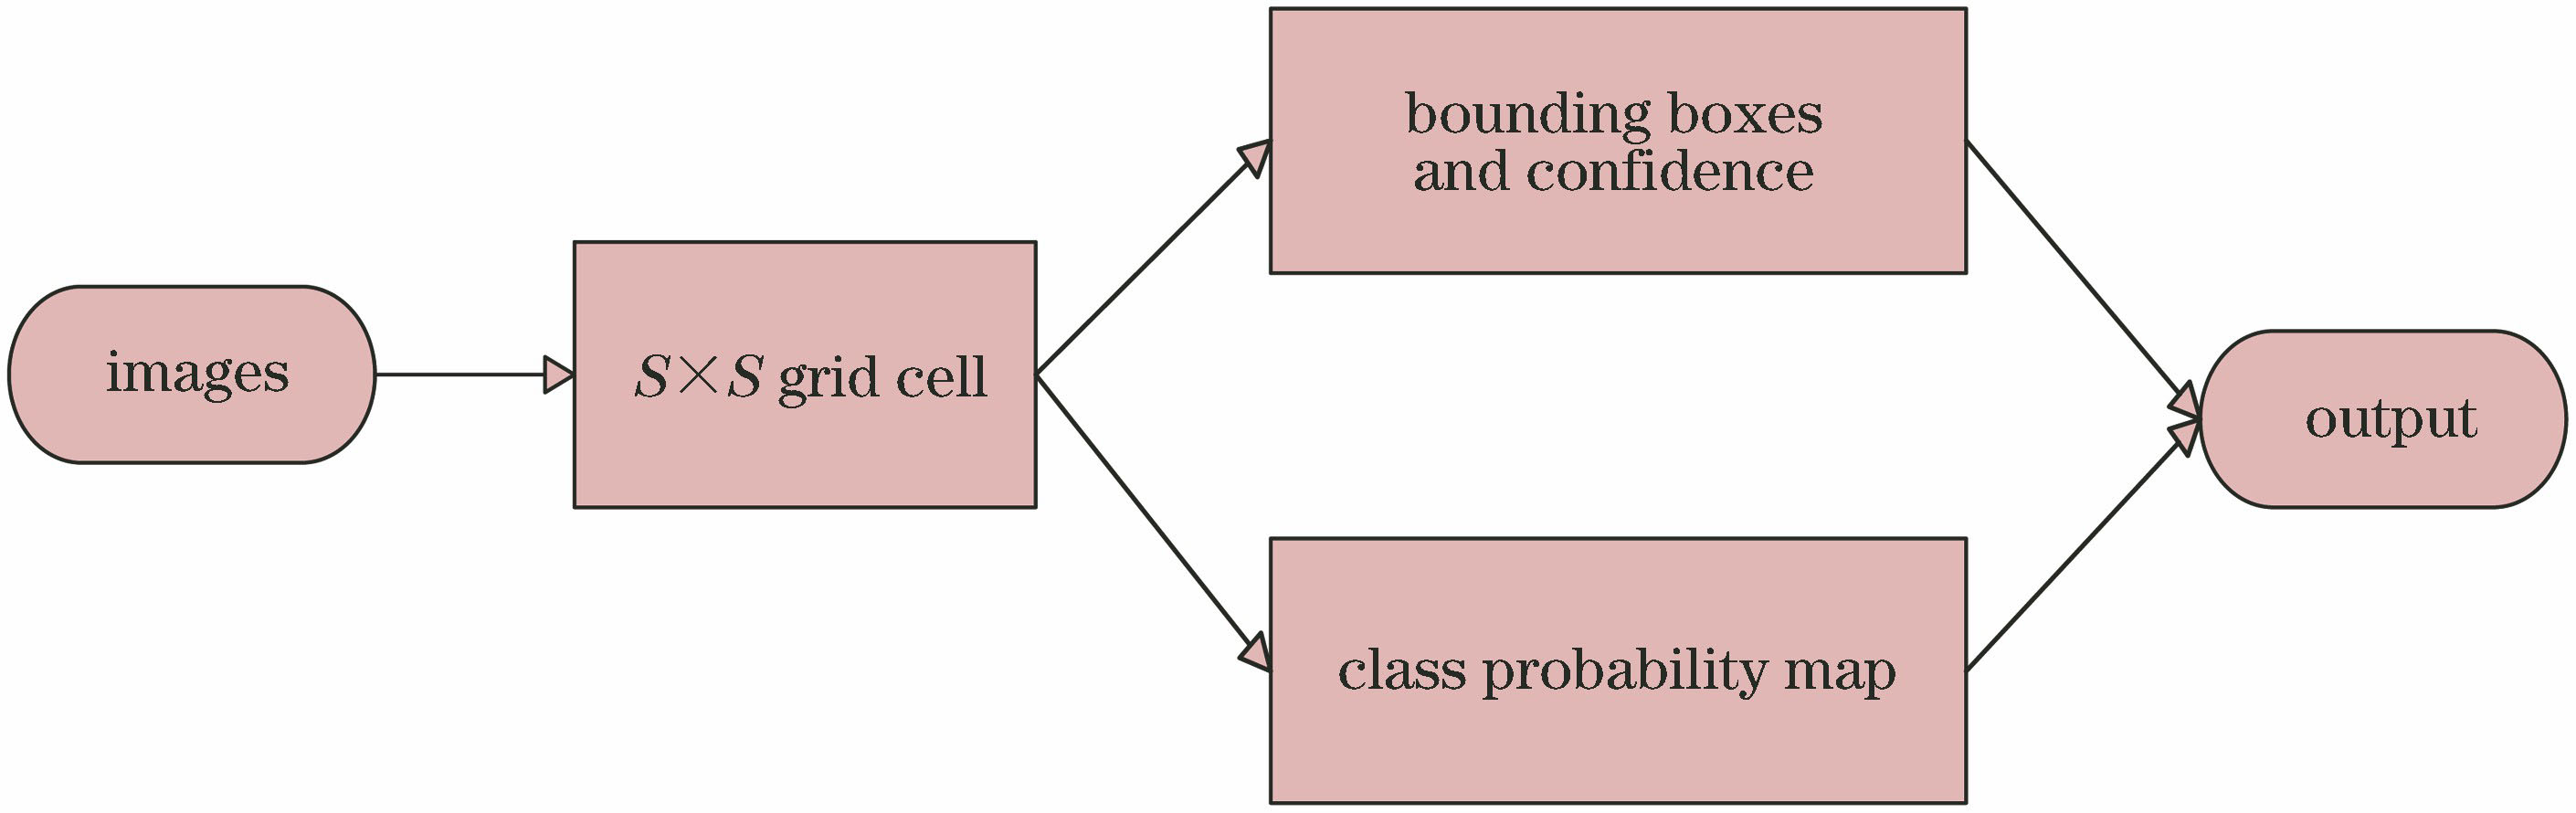
Fig. 1. Flow chart of YOLOv2 algorithm
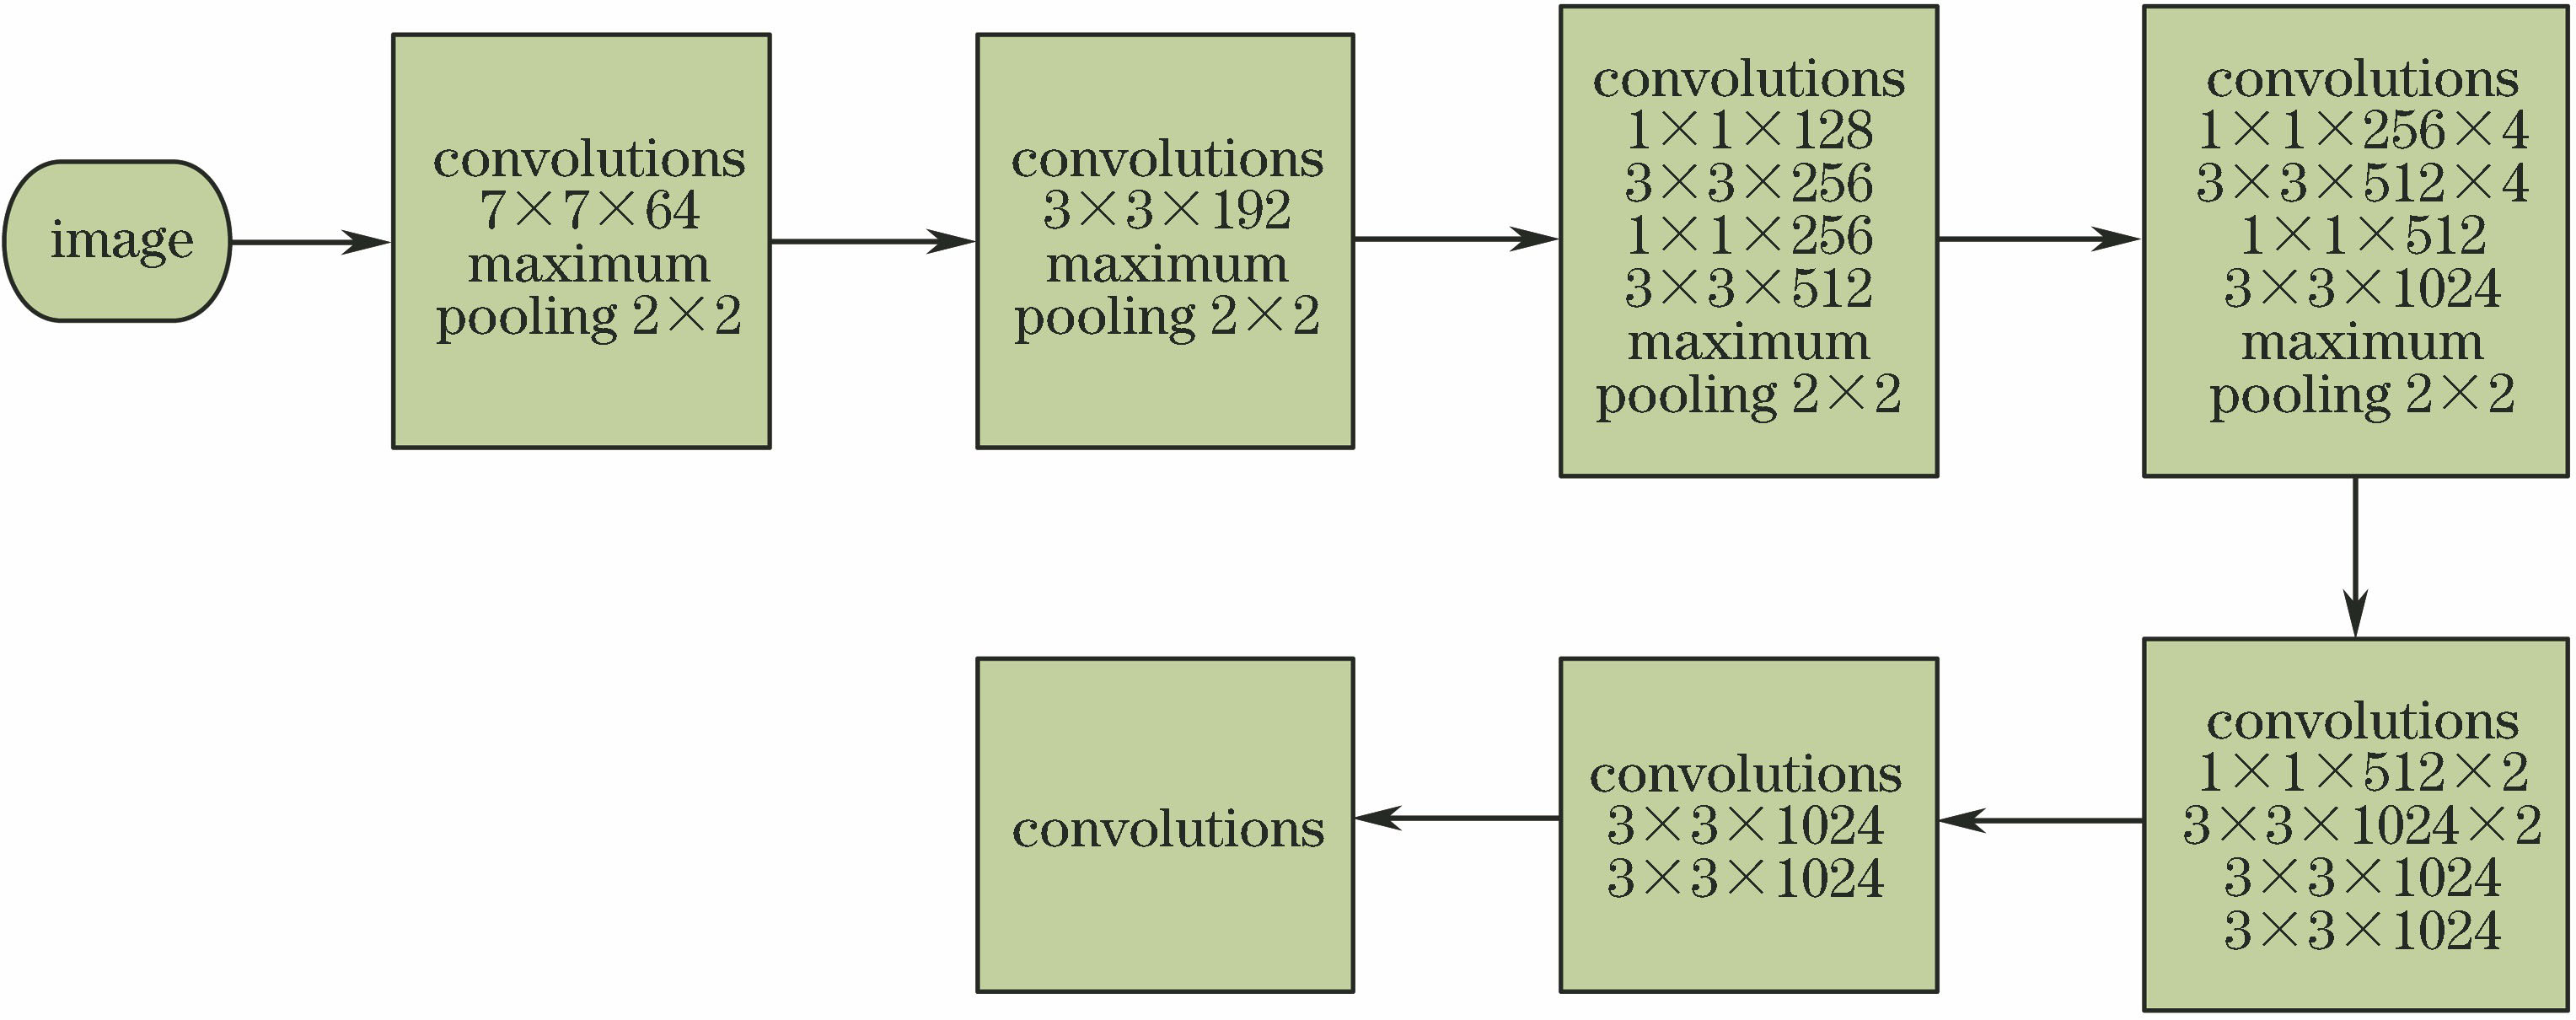
Fig. 2. YOLOv2 network structure
Fig. 3. Inception modules. (a) Module A; (b) module B
Fig. 4. NYOLOv2 structural diagram
Fig. 5. Three super classification examples of traffic signs. (a) Mandatory; (b) prohibitory; (c) danger
Fig. 6. Comparison of loss function curves
Fig. 7. Examples of detecting the loss function using YOLOv2
Fig. 8. Examples of detecting the loss function using NYOLOv2
Fig. 9. PR curves of three super categories. (a) Mandatory; (b) prohibitory; (c) danger
|
Table 1. Precisions and recall rate values at different time thresholds
|
Table 2. Comparison of different architecture performances
| |||||||||||||||||||||||||||||||||||||||
Table 3. Comparison of classification results of three methods
|
Table 4. Comparison of processing time and performance of different methods
|
Table 5. AUC values and processing time for different methods

Set citation alerts for the article
Please enter your email address
© Copyright 2018-2021 | Chinese Laser Press. All Rights Reserved 沪ICP备15018463号-20