• Acta Optica Sinica
  • Vol. 38, Issue 11, 1130001 (2018)
Xiaowen Kou1、2、*, Bin Zhou1、2、*, Xunchen Liu1、2, Haixuan Chen1、2, Meng Zhang1、2, and Pengfei Liu1
Author Affiliations
  • 1 School of Energy and Environment, Southeast University, Nanjing, Jiangsu 210096, China
  • 2 Key Laboratory for Power Machinery and Engineering of Ministry of Education, Shanghai Jiao Tong University, Shanghai 200240, China
  • show less
    DOI: 10.3788/AOS201838.1130001 Cite this Article Set citation alerts
    Xiaowen Kou, Bin Zhou, Xunchen Liu, Haixuan Chen, Meng Zhang, Pengfei Liu. Measurement of Trace NH3 Concentration in Atmosphere by Cavity Ring-Down Spectroscopy[J]. Acta Optica Sinica, 2018, 38(11): 1130001 Copy Citation Text show less
    Simulated absorbance of different gases near 1.5 μm wavelength (T=300 K, p=9.5 kPa, L=1.6×10⁴ m). (a) 6528.9 cm-1; (b) 6548.7 cm-1; (c) 6568.4 cm-1; (d) 6596.4 cm-1; (e) 6600.2 cm-1; (f) 6612.7 cm-1; (g) 6678.5 cm-1
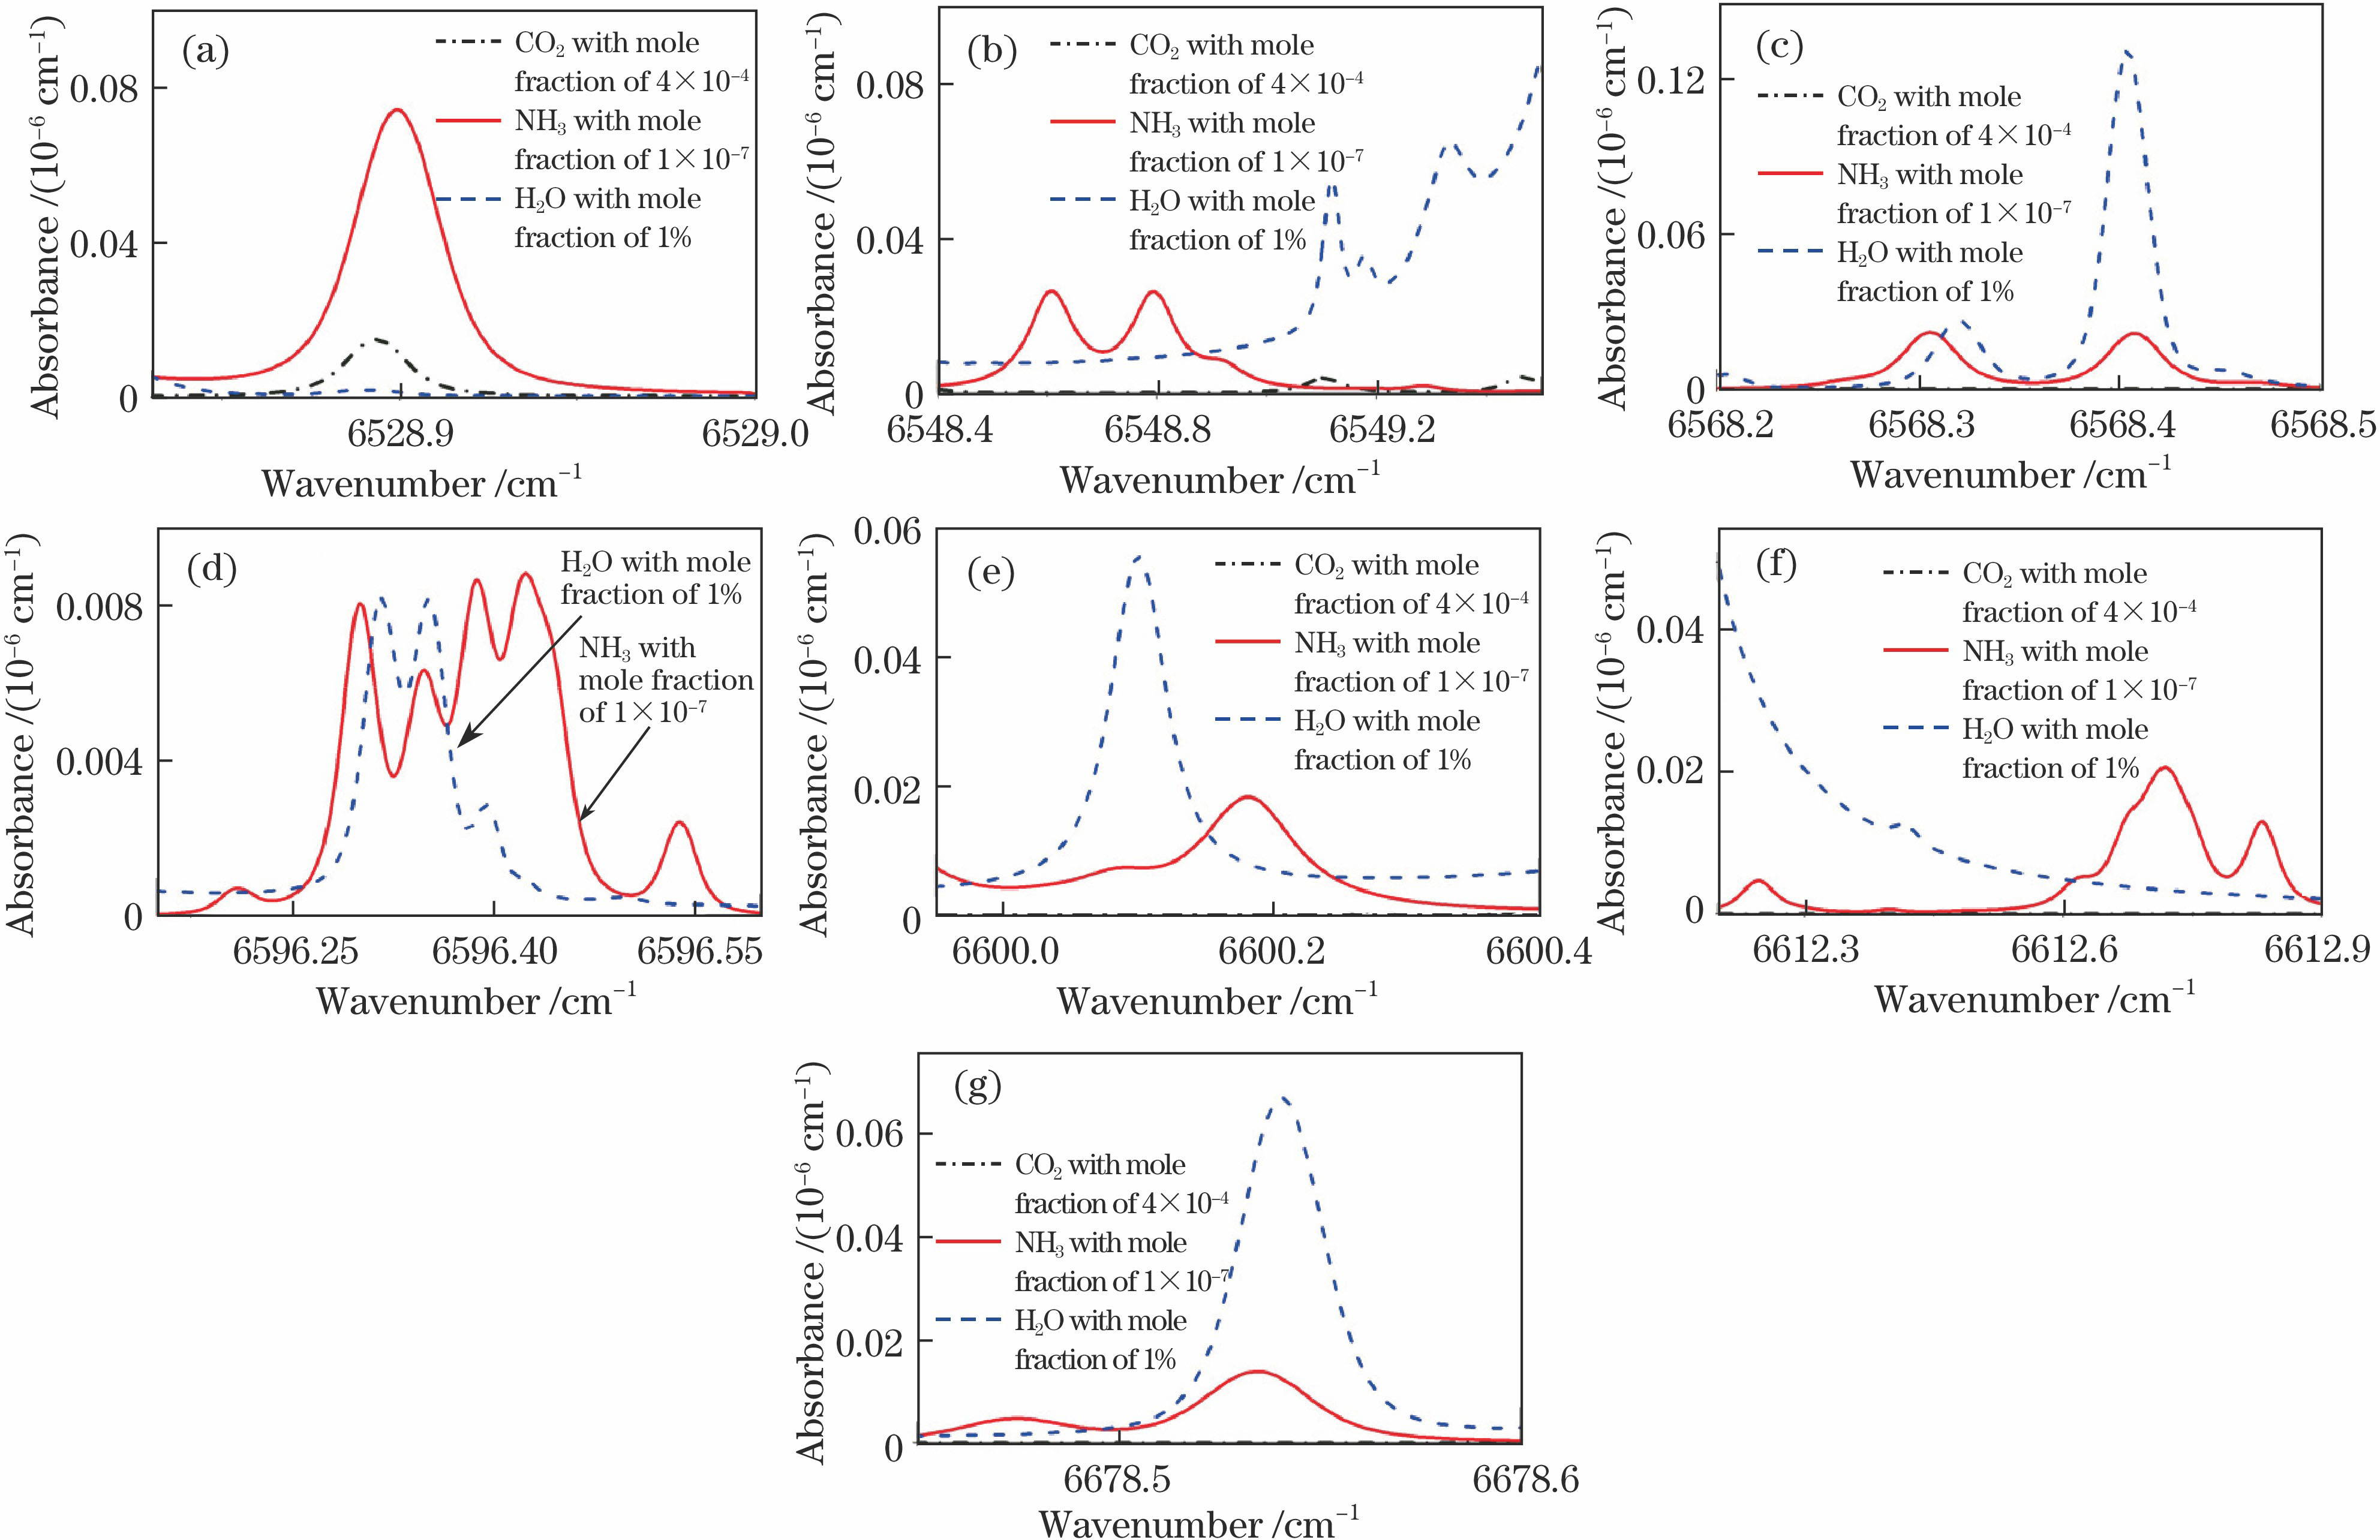
    Fig. 1. Simulated absorbance of different gases near 1.5 μm wavelength (T=300 K, p=9.5 kPa, L=1.6×10⁴ m). (a) 6528.9 cm-1; (b) 6548.7 cm-1; (c) 6568.4 cm-1; (d) 6596.4 cm-1; (e) 6600.2 cm-1; (f) 6612.7 cm-1; (g) 6678.5 cm-1
    Simulated absorbance of different gases in range of 6520-6532 cm-1 (T=300 K, p=9.5 kPa, L=1.6×10⁴ m)
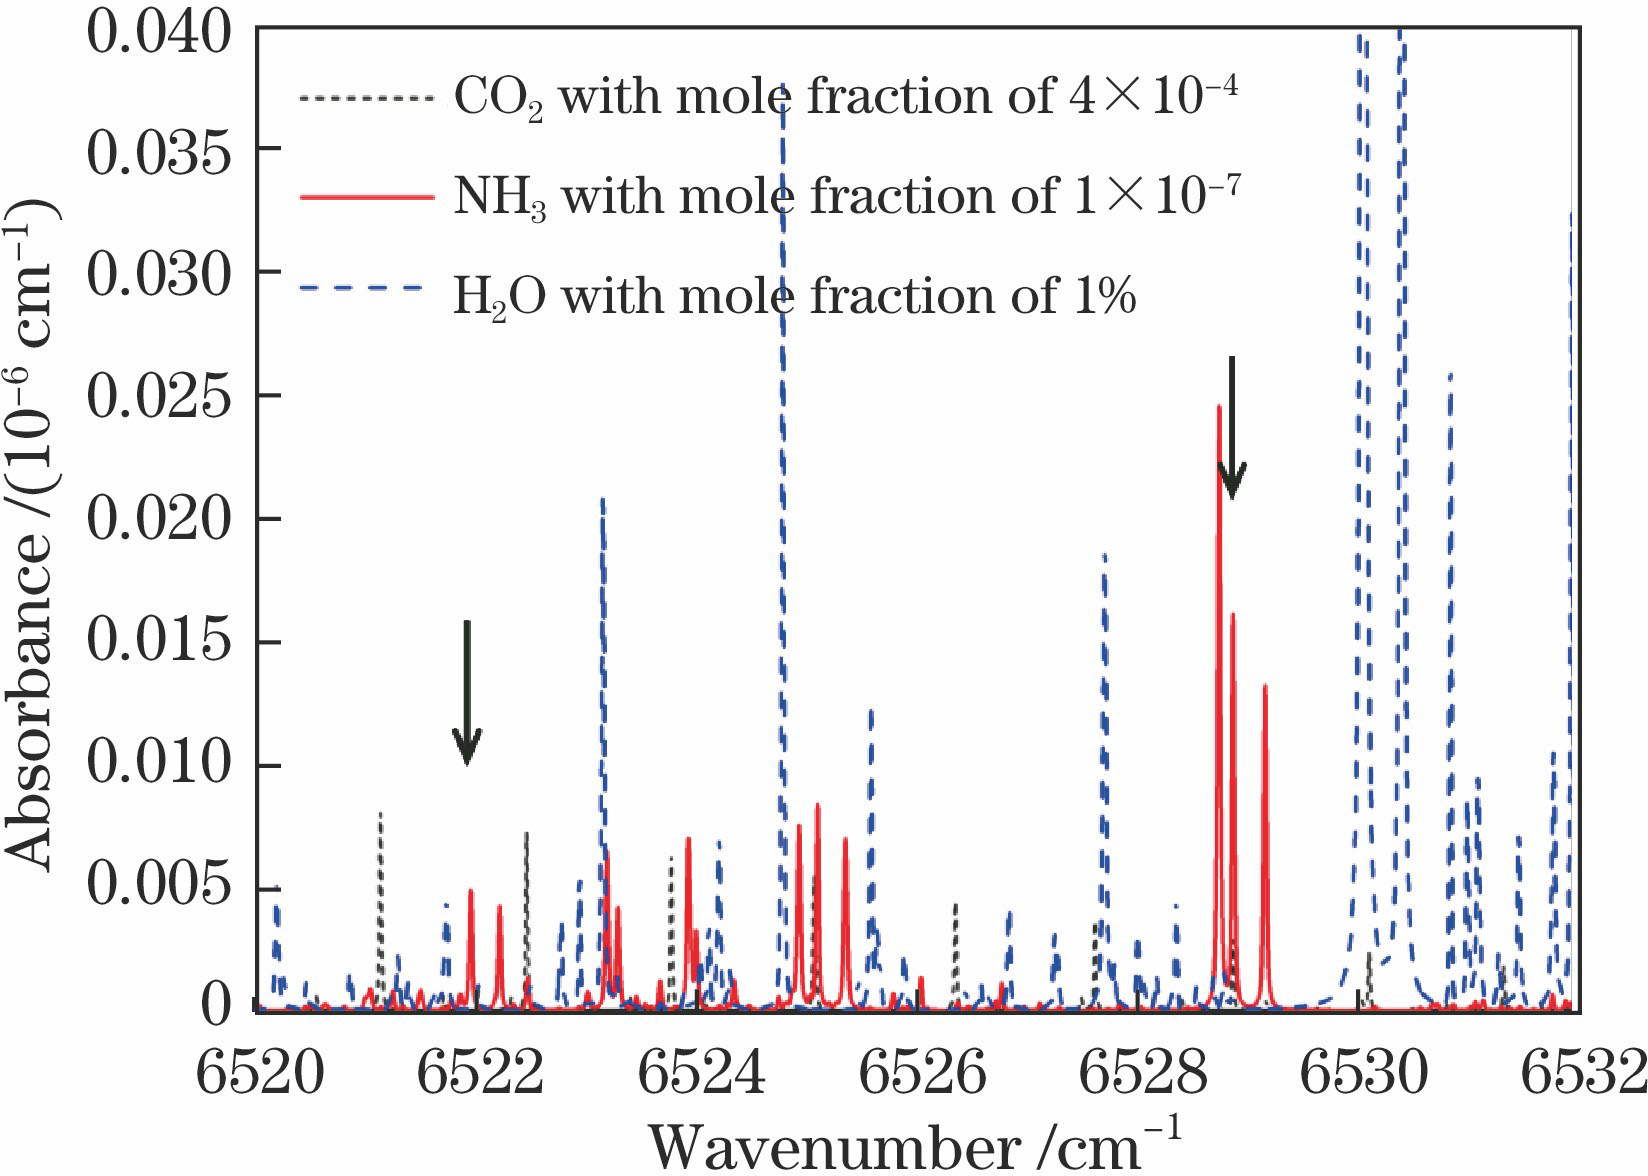
    Fig. 2. Simulated absorbance of different gases in range of 6520-6532 cm-1 (T=300 K, p=9.5 kPa, L=1.6×10⁴ m)
    Simulated absorbance of different gases near 6521.97 cm-1 (T=300 K, p=9.5 kPa, L=1.6×10⁴ m)
    Fig. 3. Simulated absorbance of different gases near 6521.97 cm-1 (T=300 K, p=9.5 kPa, L=1.6×10⁴ m)
    Schematic of laser mode matching
    Fig. 4. Schematic of laser mode matching
    Transmitted cavity mode signal
    Fig. 5. Transmitted cavity mode signal
    Schematic of CRDS experimental system
    Fig. 6. Schematic of CRDS experimental system
    Experimental gas path
    Fig. 7. Experimental gas path
    Acquisition and fitting of ring-down curve
    Fig. 8. Acquisition and fitting of ring-down curve
    Absorption lines of NH3, CO2 and H2O in atmosphere in range of 6520-6530 cm-1 (T=300 K, p=9.5 kPa, L=1.6×10⁴ m). (a) Experimental measurement data; (b) simulation results in HITRAN database
    Fig. 9. Absorption lines of NH3, CO2 and H2O in atmosphere in range of 6520-6530 cm-1 (T=300 K, p=9.5 kPa, L=1.6×10⁴ m). (a) Experimental measurement data; (b) simulation results in HITRAN database
    Absorption coefficient of 55 sampling points obtained by measurement
    Fig. 10. Absorption coefficient of 55 sampling points obtained by measurement
    Absorption results of 6521.97 cm-1 NH3 and 6522.04 cm-1 H2O spectral lines after baseline deduction
    Fig. 11. Absorption results of 6521.97 cm-1 NH3 and 6522.04 cm-1 H2O spectral lines after baseline deduction
    (a) Voigt multi-peak fitting results of NH3 and H2O absorbance; (b) fitting residual
    Fig. 12. (a) Voigt multi-peak fitting results of NH3 and H2O absorbance; (b) fitting residual
    (a) NH3 concentration obtained by a continuous measurement for 400 s in outdoor environment; (b) Allan deviation
    Fig. 13. (a) NH3 concentration obtained by a continuous measurement for 400 s in outdoor environment; (b) Allan deviation
    Mean value /μsMaximum value /μsMinimum value /μsStandard deviation /μs
    96.264098.309093.71800.6518
    Table 1. Cavity ring-down time obtained after acquisition and measurement for 1000 times
    Test gasConditionMeasured mole fractionSensitivity
    NH3indoor2.0×10-74.10×10⁻¹⁰
    NH3outdoor1.2×10-73.90×10⁻¹⁰
    CO2indoor7.6×10-42.39×10⁻⁶
    CO2outdoor3.9×10-42.35×10⁻⁶
    Table 2. Measurement results of NH3 and CO2 concentrations under different conditions
    Xiaowen Kou, Bin Zhou, Xunchen Liu, Haixuan Chen, Meng Zhang, Pengfei Liu. Measurement of Trace NH3 Concentration in Atmosphere by Cavity Ring-Down Spectroscopy[J]. Acta Optica Sinica, 2018, 38(11): 1130001
    Download Citation