
Zhongqiu Xia, Haizhi Song, Yanli Shi, Yongchao Zheng. Simulation Techniques of a Space-Borne Single-Photon Counting Imaging System[J]. Laser & Optoelectronics Progress, 2022, 59(16): 1611001
- Laser & Optoelectronics Progress
- Vol. 59, Issue 16, 1611001 (2022)
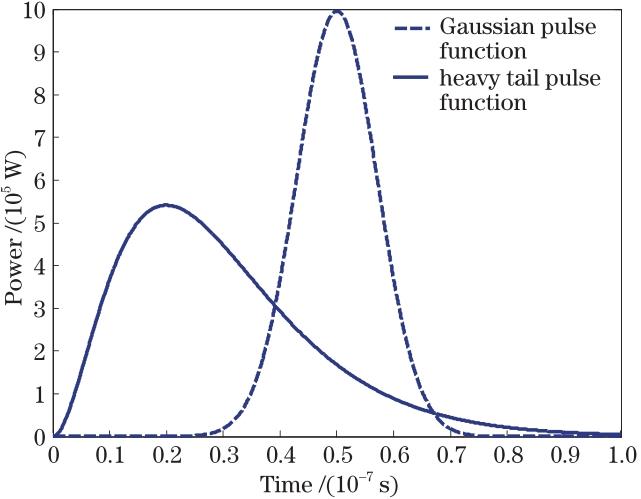
Fig. 1. Difference between Gaussian pulse function and heavy tail pulse function
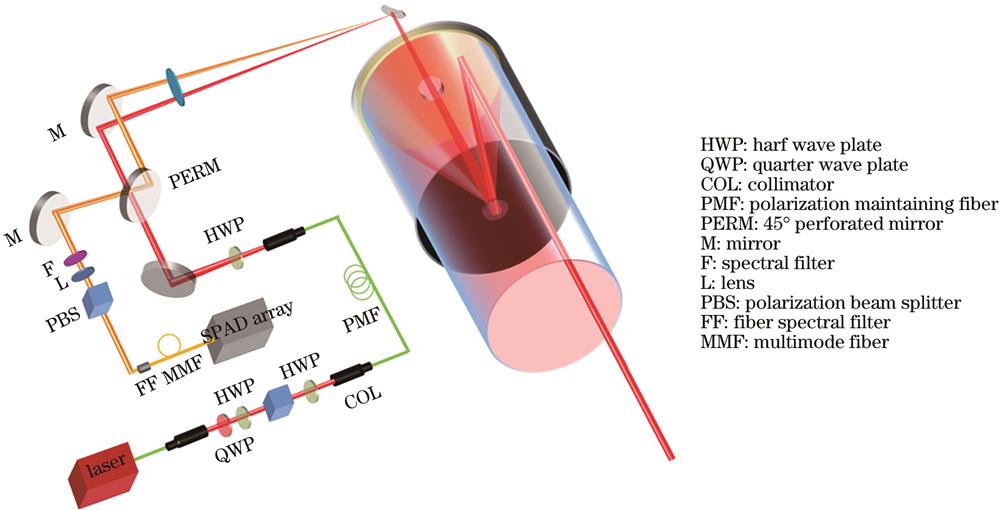
Fig. 2. Optical system of single-photon imaging
Fig. 3. Polarization filtering model of backscattering of optical system
Fig. 4. Flow chart of photon-counting of laser echo impulse
Fig. 5. Flow chart of photon counting of laser echo pulse
Fig. 6. Photon number of pulse laser echo in different orbit altitudes. (a) Orbit altitude 36000 km; (b) orbit altitude 500 km; (c) orbit altitude 250 km; (d) orbit altitude 50 km
Fig. 7. Photon number of pulse laser echo in same replication number and different gate number. (a) Replication number 100,gate number 2000; (b) replication number 100,gate number 200; (c) replication number 100,gate number 20; (d) replication number 100,gate number 4
Fig. 8. Photon number of pulse laser echo when replication number not less than gate number. (a) Replication number 2000,gate number 2000; (b) replication number 2000,gate number 1000; (c) replication number 1000,gate number 1000; (d) replication number 1000,gate number 200
|
Table 1. Pulse laser parameters
|
Table 2. Optical system parameters
|
Table 3. SPAD parameters
|
Table 4. Simulation results of ranging accuracy

Set citation alerts for the article
Please enter your email address
© Copyright 2018-2021 | Chinese Laser Press. All Rights Reserved 沪ICP备15018463号-20