• Photonics Research
  • Vol. 8, Issue 4, 539 (2020)
Jason Jerwick1、2, Yongyang Huang1, Zhao Dong1、2, Adrienne Slaudades3, Alexander J. Brucker3, and Chao Zhou1、2、4、*
Author Affiliations
  • 1Department of Electrical and Computer Engineering, Lehigh University, Bethlehem, Pennsylvania 18015, USA
  • 2Department of Biomedical Engineering, Washington University in St. Louis, St. Louis, Missouri 63130, USA
  • 3Scheie Eye Institute, Penn Presbyterian Medical Center, University of Pennsylvania, Philadelphia, Pennsylvania 19104, USA
  • 4Department of Bioengineering, Lehigh University, Bethlehem, Pennsylvania 18015, USA
  • show less
    DOI: 10.1364/PRJ.383034 Cite this Article Set citation alerts
    Jason Jerwick, Yongyang Huang, Zhao Dong, Adrienne Slaudades, Alexander J. Brucker, Chao Zhou. Wide-field ophthalmic space-division multiplexing optical coherence tomography[J]. Photonics Research, 2020, 8(4): 539 Copy Citation Text show less
    (a) Schematic for the ophthalmic SDM-OCT system. BOA, booster optical amplifier; FBG, fiber Bragg grating; MZI, Mach–Zehnder interferometer; PD, balanced photodetector. (b) Picture of the ophthalmic SDM-OCT prototype in the clinic.
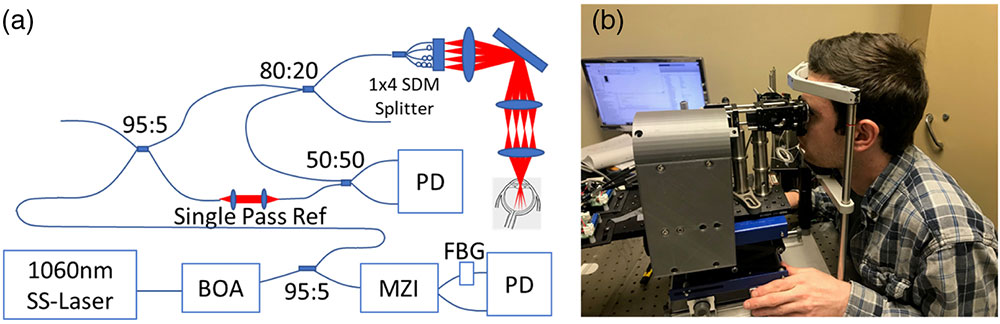
    Fig. 1. (a) Schematic for the ophthalmic SDM-OCT system. BOA, booster optical amplifier; FBG, fiber Bragg grating; MZI, Mach–Zehnder interferometer; PD, balanced photodetector. (b) Picture of the ophthalmic SDM-OCT prototype in the clinic.
    Geometric considerations for ophthalmic SDM-OCT design. (a) Projection of the curvature of the eye onto the imaging space. (b) Image space separated into four imaging beams with 3 mm optical delay. All four beams fit in the 12 mm image depth. (c) Distance between adjacent beams shows there is no overlapping between adjacent images. (d) Sensitivity roll-off measured over the entire imaging depth range.
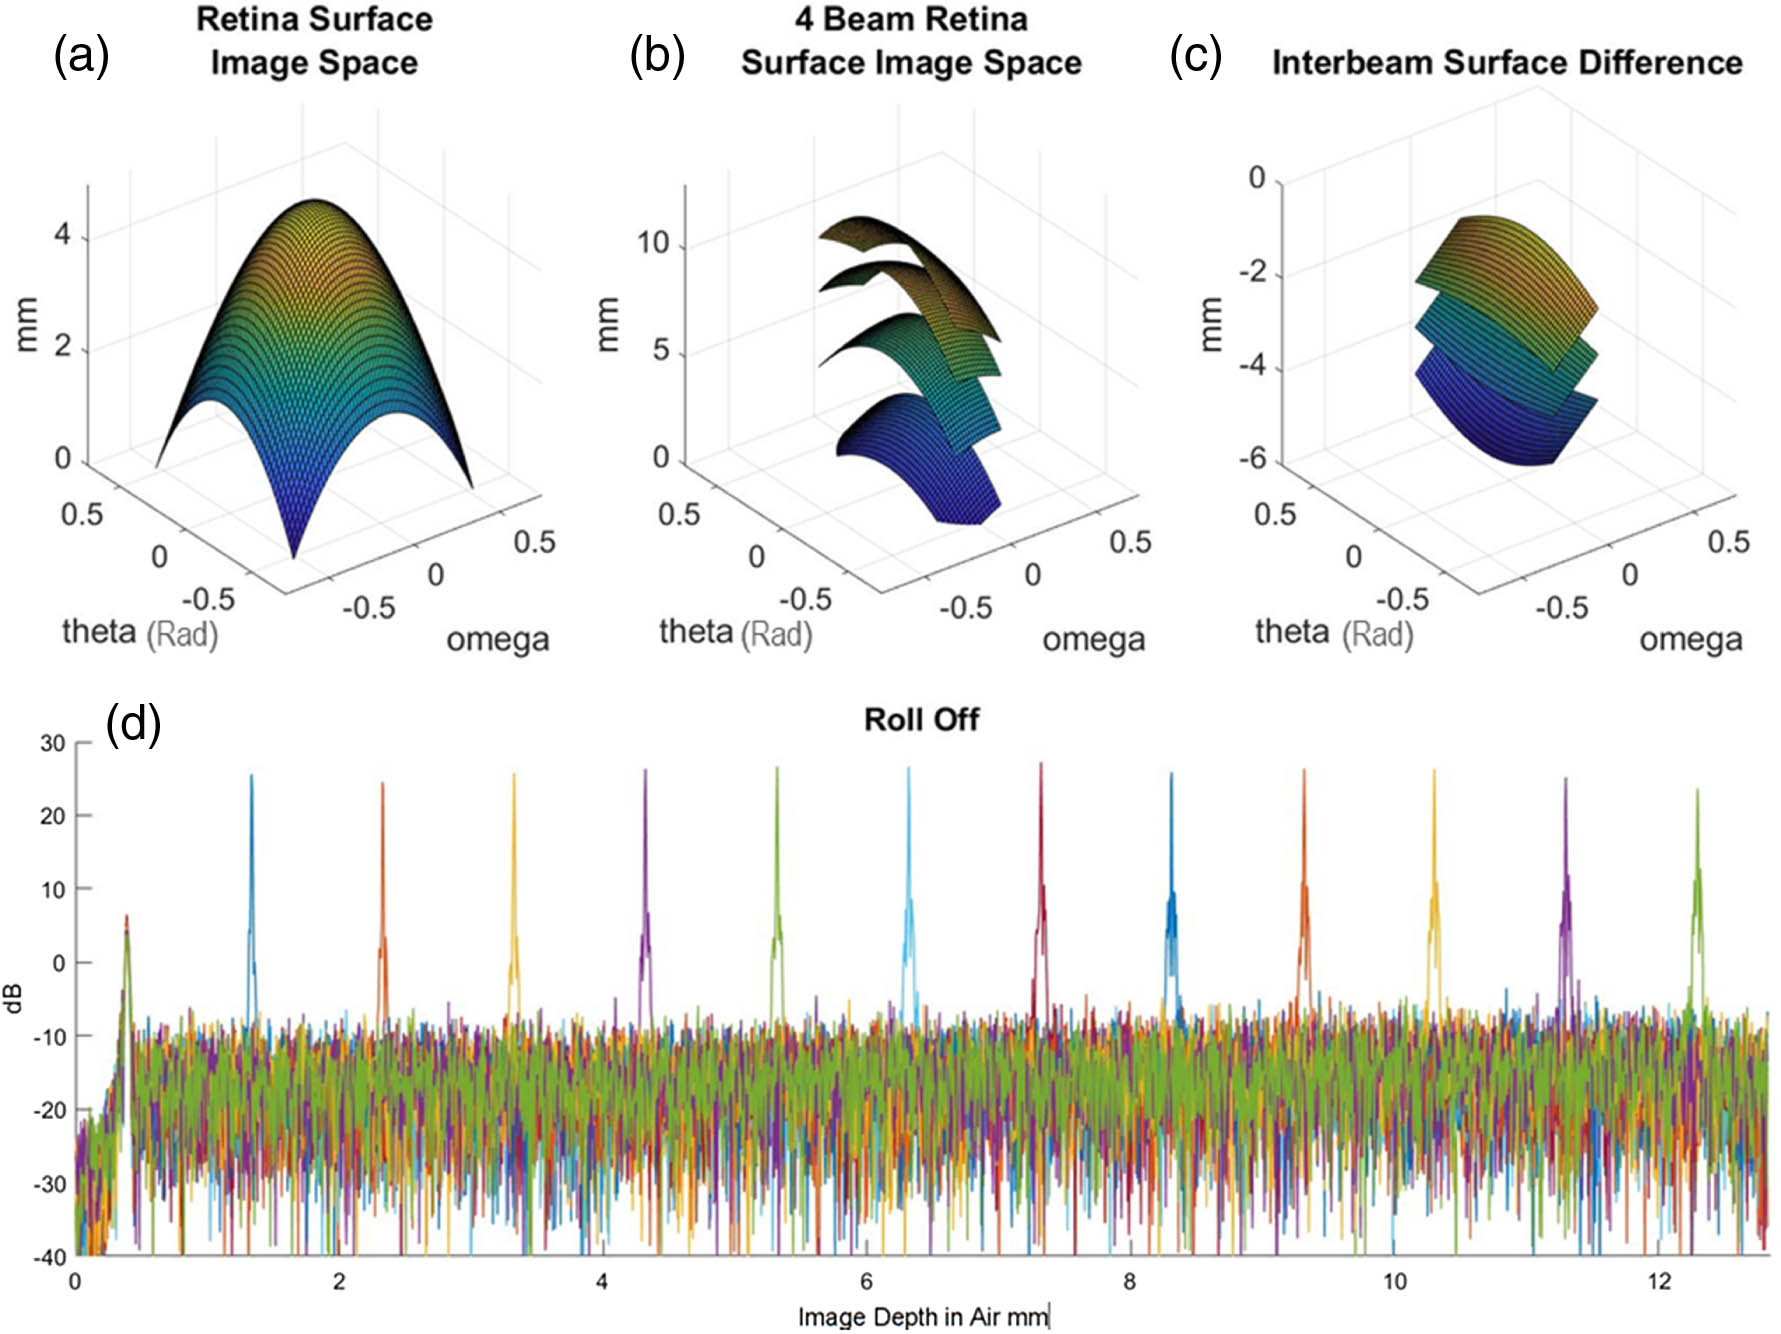
    Fig. 2. Geometric considerations for ophthalmic SDM-OCT design. (a) Projection of the curvature of the eye onto the imaging space. (b) Image space separated into four imaging beams with 3 mm optical delay. All four beams fit in the 12 mm image depth. (c) Distance between adjacent beams shows there is no overlapping between adjacent images. (d) Sensitivity roll-off measured over the entire imaging depth range.
    (a) Four-beam raw SDM-OCT image. (b) En face projection of the RPE layer; yellow line shows location of vertical cross section and green line shows location of horizontal cross-section. (c) Vertical cross-section. (d) Horizontal cross-section with some selected anatomical features labeled. CHR, choroid; EZ, ellipsoid zone; ILM, internal limiting membrane; IPL, inner plexiform layer; ONH, optic nerve head; OPL, outer plexiform layer; RPE, retinal pigment epithelium. (e) Retinal thickness map. (f) 3D rendering of stitched SDM-OCT images (also see Visualization 1). Scale bars 1 mm.
    Fig. 3. (a) Four-beam raw SDM-OCT image. (b) En face projection of the RPE layer; yellow line shows location of vertical cross section and green line shows location of horizontal cross-section. (c) Vertical cross-section. (d) Horizontal cross-section with some selected anatomical features labeled. CHR, choroid; EZ, ellipsoid zone; ILM, internal limiting membrane; IPL, inner plexiform layer; ONH, optic nerve head; OPL, outer plexiform layer; RPE, retinal pigment epithelium. (e) Retinal thickness map. (f) 3D rendering of stitched SDM-OCT images (also see Visualization 1). Scale bars 1 mm.
    SDM-OCT and commercial OCT images from a patient diagnosed with retinal telangiectasia. (a) En face projection SDM-OCT. (b) Vertical cross-section SDM-OCT. (c) Horizontal cross-section SDM-OCT. (d) En face SLO image of commercial system imaging range (5 mm×3 mm). (e) Vertical cross-section commercial OCT. (f) Horizontal cross-section commercial OCT. (g) Zoomed-in region of interest (ROI) from SDM-OCT. (h) Zoomed-in ROI from commercial OCT. (i) Retinal thickness map. (j) 3D rendering of stitched SDM-OCT images (also see Visualization 2). Lateral scale bars 1 mm. Axial scale bars 500 μm for (b), (c), (e), and (f) and 200 μm for (g) and (h).
    Fig. 4. SDM-OCT and commercial OCT images from a patient diagnosed with retinal telangiectasia. (a) En face projection SDM-OCT. (b) Vertical cross-section SDM-OCT. (c) Horizontal cross-section SDM-OCT. (d) En face SLO image of commercial system imaging range (5  mm×3  mm). (e) Vertical cross-section commercial OCT. (f) Horizontal cross-section commercial OCT. (g) Zoomed-in region of interest (ROI) from SDM-OCT. (h) Zoomed-in ROI from commercial OCT. (i) Retinal thickness map. (j) 3D rendering of stitched SDM-OCT images (also see Visualization 2). Lateral scale bars 1 mm. Axial scale bars 500 μm for (b), (c), (e), and (f) and 200 μm for (g) and (h).
    SDM-OCT and commercial OCT images from a patient diagnosed with exudative age-related macular degeneration. (a) En face projection of RPE SDM-OCT. (b) Vertical cross-section SDM-OCT. (c) Horizontal cross-section SDM-OCT. (d) En face SLO image of commercial system imaging range. (e) Vertical cross-section commercial OCT. (f) Horizontal cross-section commercial OCT. (g) Zoomed-in ROI from SDM-OCT. (h) Zoomed-in ROI from commercial OCT. (i) Retinal thickness map. Yellow arrow indicates region with retinal thinning. (j) 3D rendering of stitched SDM-OCT images (also see Visualization 3). Lateral scale bars 1 mm. Axial scale bars 500 μm for (b), (c), (e), and (f) and 200 μm for (g) and (h).
    Fig. 5. SDM-OCT and commercial OCT images from a patient diagnosed with exudative age-related macular degeneration. (a) En face projection of RPE SDM-OCT. (b) Vertical cross-section SDM-OCT. (c) Horizontal cross-section SDM-OCT. (d) En face SLO image of commercial system imaging range. (e) Vertical cross-section commercial OCT. (f) Horizontal cross-section commercial OCT. (g) Zoomed-in ROI from SDM-OCT. (h) Zoomed-in ROI from commercial OCT. (i) Retinal thickness map. Yellow arrow indicates region with retinal thinning. (j) 3D rendering of stitched SDM-OCT images (also see Visualization 3). Lateral scale bars 1 mm. Axial scale bars 500 μm for (b), (c), (e), and (f) and 200 μm for (g) and (h).
    SDM-OCT and commercial OCT images from a patient diagnosed with non-proliferative diabetic retinopathy. (a) En face projection SDM-OCT. (b) Vertical cross-section SDM-OCT. (c) Horizontal cross-section SDM-OCT. (d) En face SLO image of commercial system imaging range. (e) Vertical cross-section commercial OCT. (f) Horizontal cross-section commercial OCT. (g) 3D rendering of SDM-OCT image stack (also see Visualization 4). (h) Retinal thickness map. (i) En face projection of the outer plexiform layer showing microcysts highlighted by the yellow arrows. (j) Fluorescein angiogram showing matching microcysts to Fig. 5(h). Lateral scale bars 1 mm. Axial scale bars 500 μm for (b), (c), (e), and (f).
    Fig. 6. SDM-OCT and commercial OCT images from a patient diagnosed with non-proliferative diabetic retinopathy. (a) En face projection SDM-OCT. (b) Vertical cross-section SDM-OCT. (c) Horizontal cross-section SDM-OCT. (d) En face SLO image of commercial system imaging range. (e) Vertical cross-section commercial OCT. (f) Horizontal cross-section commercial OCT. (g) 3D rendering of SDM-OCT image stack (also see Visualization 4). (h) Retinal thickness map. (i) En face projection of the outer plexiform layer showing microcysts highlighted by the yellow arrows. (j) Fluorescein angiogram showing matching microcysts to Fig. 5(h). Lateral scale bars 1 mm. Axial scale bars 500 μm for (b), (c), (e), and (f).
    SystemCenter Wavelength (nm)Laser Sweep Rate (kHz)BeamsEffective A-Scan Rate (kHz)Sensitivity (dB)
    1st generation SDM-OCT [22]1310100880094.6
    SOI chip-based SDM-OCT [29]1310100880091
    Ophthalmic SDM-OCT1060200480091
    Table 1. Comparison of SDM-OCT Systems
    Jason Jerwick, Yongyang Huang, Zhao Dong, Adrienne Slaudades, Alexander J. Brucker, Chao Zhou. Wide-field ophthalmic space-division multiplexing optical coherence tomography[J]. Photonics Research, 2020, 8(4): 539
    Download Citation