• Acta Physica Sinica
  • Vol. 69, Issue 16, 165201-1 (2020)
Li-Tuo Liu1、*, Chun-Long Wang2, Xiao-Ya Yu3, Jun-Kai Shi1, Yao Li1, Xiao-Mei Chen1, and Wei-Hu Zhou1
Author Affiliations
  • 1Institute of Microelectronics, Chinese Academy of Sciences, Beijing 100094, China
  • 2Liberation Army 32180, Beijing 100012, China
  • 3Key Laboratory of Experimental Physics and Computational Mathematics, Beijing 100094, China
  • show less
    DOI: 10.7498/aps.69.20200517 Cite this Article
    Li-Tuo Liu, Chun-Long Wang, Xiao-Ya Yu, Jun-Kai Shi, Yao Li, Xiao-Mei Chen, Wei-Hu Zhou. Study of nano particle stripping and composition inspection on wafer surface[J]. Acta Physica Sinica, 2020, 69(16): 165201-1 Copy Citation Text show less
    Schematic diagram of laser cleaning mechanism.
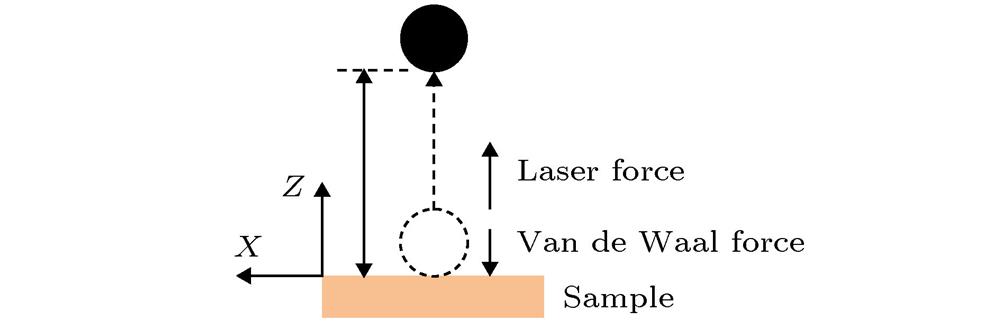
    Fig. 1. Schematic diagram of laser cleaning mechanism.
    Schematic diagram of experimental system.
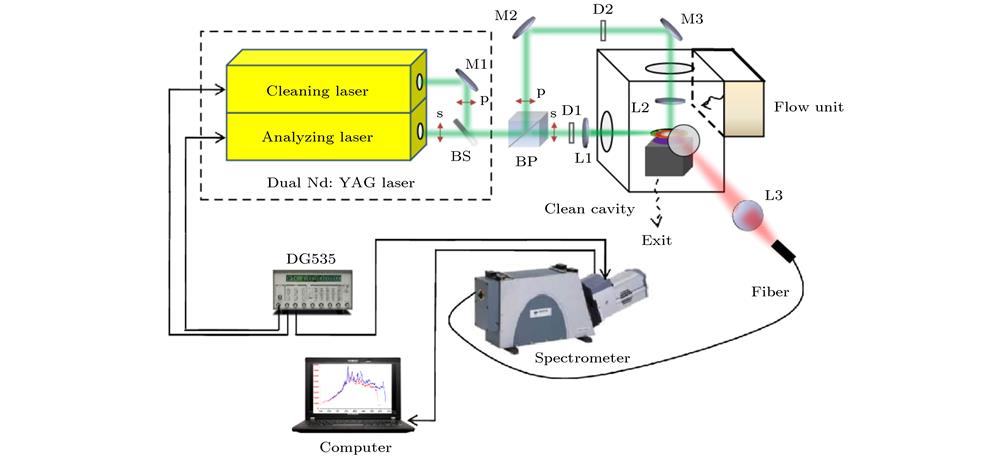
    Fig. 2. Schematic diagram of experimental system.
    SEM image for breakdown threshold of silicon wafer.
    Fig. 3. SEM image for breakdown threshold of silicon wafer.
    Confocal microscope images under different laser power densities: (a) 10 × 107 W/cm2; (b) 8 × 10⁷ W/cm2; (c) 6 × 10⁷ W/cm2.
    Fig. 4. Confocal microscope images under different laser power densities: (a) 10 × 107 W/cm2; (b) 8 × 10⁷ W/cm2; (c) 6 × 10⁷ W/cm2.
    Time evolution features of LIBS from copper plate.
    Fig. 5. Time evolution features of LIBS from copper plate.
    LIBS experimental results of air and the sample.
    Fig. 6. LIBS experimental results of air and the sample.
    Delay time experimental results of sample 1: (a) delay time is 0−1 ms, (b) delay time is 0−30 ms.
    Fig. 7. Delay time experimental results of sample 1: (a) delay time is 0−1 ms, (b) delay time is 0−30 ms.
    Experimental results of Cu particles with different concentrations when delay time was 1 ms: (a) 3D spectral intensity; (b) peak of spectral intensity.
    Fig. 8. Experimental results of Cu particles with different concentrations when delay time was 1 ms: (a) 3D spectral intensity; (b) peak of spectral intensity.
    Sample No.12345
    Concentration/1013 atoms·cm–215276385.12.1
    Table 1.

    Five samples of different concentrations.

    5种不同浓度样品

    Spots No.12345
    Power density/108 W·cm–21.641.521.321.211.11
    Table 2.

    Experimental results of silicon wafer damage threshold.

    硅片击穿阈值实验结果

    Li-Tuo Liu, Chun-Long Wang, Xiao-Ya Yu, Jun-Kai Shi, Yao Li, Xiao-Mei Chen, Wei-Hu Zhou. Study of nano particle stripping and composition inspection on wafer surface[J]. Acta Physica Sinica, 2020, 69(16): 165201-1
    Download Citation