- Spectroscopy and Spectral Analysis
- Vol. 42, Issue 5, 1426 (2022)
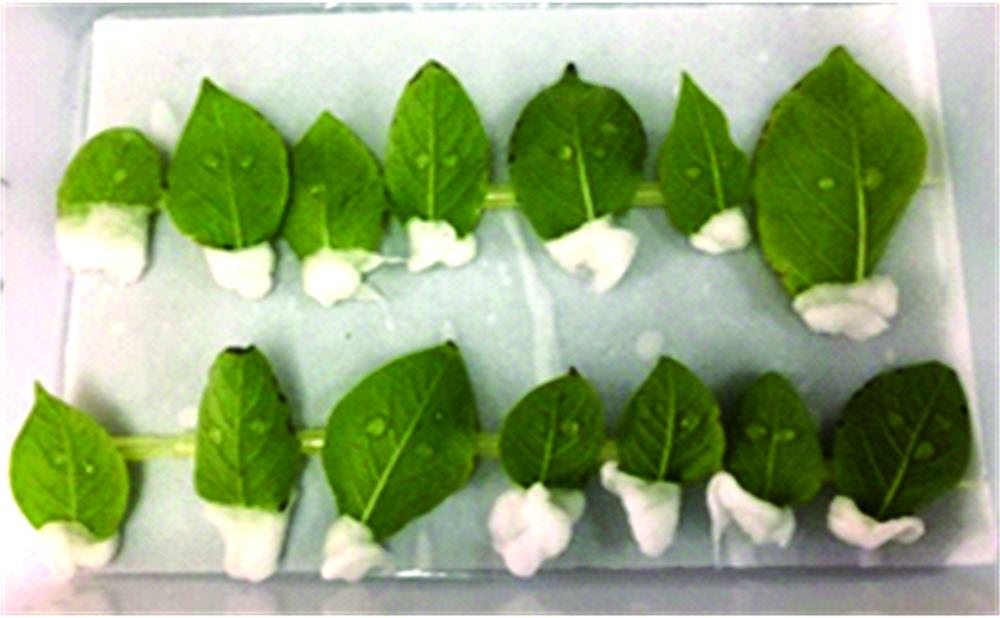
Fig. 1. Detached potato leaves after inoculation
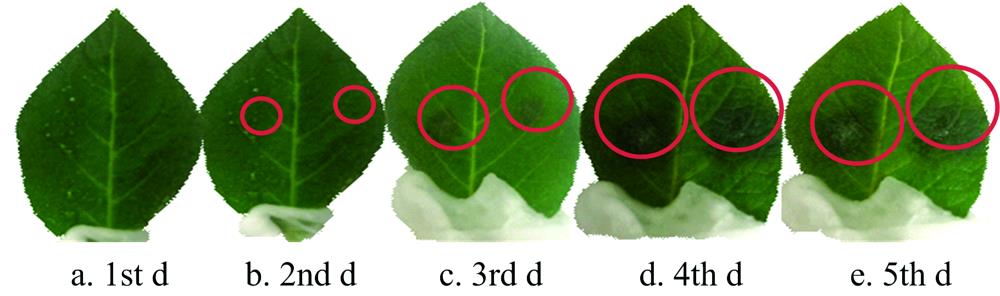
Fig. 2. The images of leaves cultivated at a temperature of 20 ℃ and 70% humidity for one day to five days
Fig. 3. Spectroscopic acquisition system
1: Reflection probe; 2: Fiber;3: USB4000 spectrometer
1: Reflection probe; 2: Fiber;3: USB4000 spectrometer
Fig. 4. Detection results of abnormal samples
Fig. 5. Spectral curves of potato leaves with different inoculation times
Fig. 6. Changes of POD enzyme activity with inoculation time under the same humidity and different temperature conditions
(a): 70%; (b): 80%; (c): 90%
(a): 70%; (b): 80%; (c): 90%
Fig. 7. Changes of POD enzyme activity with inoculation time under the same temperature and different humidity conditions
(a): 15 ℃; (b): 20 ℃; (c): 25 ℃ Note: The leaves with inoculation time of 0 days are healthy leaves
(a): 15 ℃; (b): 20 ℃; (c): 25 ℃ Note: The leaves with inoculation time of 0 days are healthy leaves
Fig. 8. The trend of the model root mean square error with the number of variables
Fig. 9. Distribution of characteristic wavelengths
Fig. 10. The results of CARS algorithm
Fig. 11. The prediction modeling results of the sample's disease degree established by multiple linear regression analysis (a) and RBFNN (b)
|
Table 1. Statistical results of POD enzyme activity of potato leaves
| ||||||||||||||||||||||||||||||||||||||||||||||||||||||||||||||||
Table 2. PLS model results of full-wavelength spectrum data preprocessed by different methods
|
Table 3. Feature wavelength extracted by algorithms
| ||||||||||||||||||||||||||||||||||
Table 4. PLS model results based on characteristic wavelength and full wavelength

Download Citation


Set citation alerts for the article
Please enter your email address

© Copyright 2018-2021 | Chinese Laser Press. All Rights Reserved 沪ICP备15018463号-20