• Photonics Research
  • Vol. 4, Issue 6, 249 (2016)
Jiaqi Zhao, Chaoyi Qin, Mengjie Zhang, and Nan Chi*
Author Affiliations
  • Key Laboratory for Information Science of Electromagnetic Waves (MoE), Department of Communication Science and Engineering, Fudan University, Shanghai 200433, China
  • show less
    DOI: 10.1364/PRJ.4.000249 Cite this Article Set citation alerts
    Jiaqi Zhao, Chaoyi Qin, Mengjie Zhang, Nan Chi. Investigation on performance of special-shaped 8-quadrature amplitude modulation constellations applied in visible light communication[J]. Photonics Research, 2016, 4(6): 249 Copy Citation Text show less
    8-QAM constellation design.
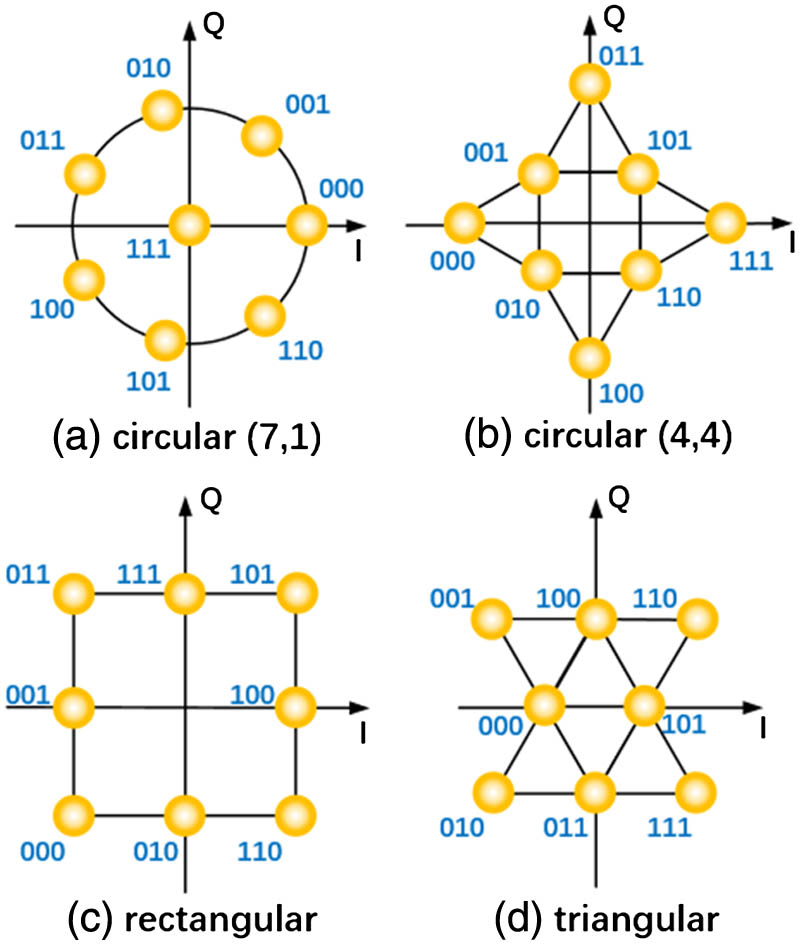
    Fig. 1. 8-QAM constellation design.
    BER versus average SNR.
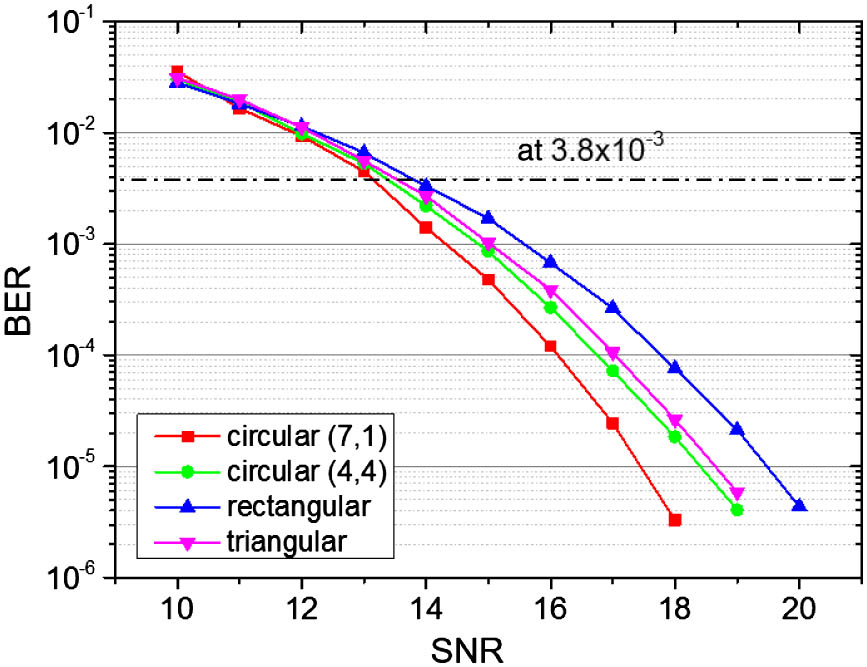
    Fig. 2. BER versus average SNR.
    Frequency response of a commercial LED.
    Fig. 3. Frequency response of a commercial LED.
    BER versus baud rate under high-frequency attenuation.
    Fig. 4. BER versus baud rate under high-frequency attenuation.
    U–I curve of the red chip of a commercial RGB–LED (LZ4-00MA00).
    Fig. 5. U–I curve of the red chip of a commercial RGB–LED (LZ4-00MA00).
    CCDF of PAPRs for single-carrier, special-shaped 8-QAM signals.
    Fig. 6. CCDF of PAPRs for single-carrier, special-shaped 8-QAM signals.
    Experimental setup of single-carrier, special-shaped 8-QAM VLC system.
    Fig. 7. Experimental setup of single-carrier, special-shaped 8-QAM VLC system.
    BER versus different bias voltage and signal vpp for (a) circular (7,1), (b) circular (4,4), (c) rectangular, and (d) triangular.
    Fig. 8. BER versus different bias voltage and signal vpp for (a) circular (7,1), (b) circular (4,4), (c) rectangular, and (d) triangular.
    BER versus signal vpp (a) at bias voltage=1.8 V, (b) at bias voltage=2.0 V, and (c) at bias voltage=2.3 V.
    Fig. 9. BER versus signal vpp (a) at bias voltage=1.8  V, (b) at bias voltage=2.0  V, and (c) at bias voltage=2.3  V.
    Q-factor comparison for different 8-QAM constellations.
    Fig. 10. Q-factor comparison for different 8-QAM constellations.
    Baud rate comparison for different 8-QAM constellations.
    Fig. 11. Baud rate comparison for different 8-QAM constellations.
    Highest baud rate versus transmission for different 8-QAM.
    Fig. 12. Highest baud rate versus transmission for different 8-QAM.
    ConstellationMin_Euclidean
    Circular (7,1)0.9277
    Circular (4,4)0.9194
    Rectangular0.8165
    Triangular0.8729
    Table 1. Minimum Euclidean Distances of Special-Shaped 8-QAM Constellations
    ConstellationPAPR
    Circular (7,1)1.1429
    Circular (4,4)1.5774
    Rectangular1.3333
    Triangular1.5238
    Table 2. PAPRs of Different Special-Shaped 8-QAM Constellations
    ConstellationCircular (7,1)Circular (4,4)
    Dynamic rangeV_Bias=1.8  V0.40 V (0.30 V–0.70 V)V_Bias=1.8  V0.14 V (0.48 V–0.62 V)
    V_Bias=2.0  V0.60 V (0.22 V–0.82 V)V_Bias=2.0  V0.46 V (0.32 V–0.78 V)
    V_Bias=2.3  V0.37 V (0.41  V–0.78 V)V_Bias=2.3  V0.12 V (0.48 V–0.60 V)
    ConstellationRectangularTriangular
    Dynamic rangeV_Bias=1.8  V0.22 V (0.48 V–0.70 V)V_Bias=1.8  V0.23 V (0.4 V–0.63 V)
    V_Bias=2.0  V0.48 V (0.32 V–0.8 V)V_Bias=2.0  V0.46 V (0.32 V–0.78 V)
    V_Bias=2.3  V0.34 V (0.45 V–0.79 V)V_Bias=2.3  V0.34 V (0.48 V–0.82 V)
    Table 3. Dynamic Range of Signal VPP Under Different Bias Voltage
    Jiaqi Zhao, Chaoyi Qin, Mengjie Zhang, Nan Chi. Investigation on performance of special-shaped 8-quadrature amplitude modulation constellations applied in visible light communication[J]. Photonics Research, 2016, 4(6): 249
    Download Citation