
X. P. Hu, P. Xu, S. N. Zhu. Engineered quasi-phase-matching for laser techniques [Invited][J]. Photonics Research, 2013, 1(4): 171
- Photonics Research
- Vol. 1, Issue 4, 171 (2013)
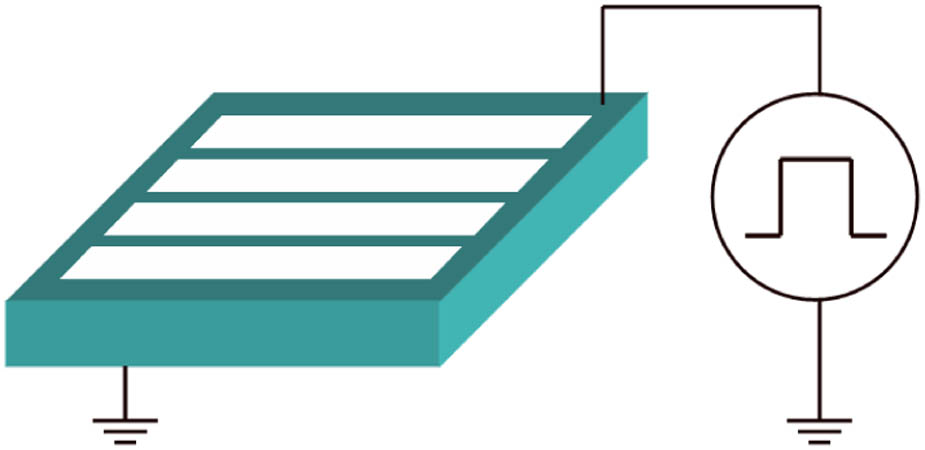
Fig. 1. Schematic setup of the electric-field poling technique.
![10-mm-thick MgO:PPLN with a poling period of 32.2 μm. Selected from Ref. [43].](/richHtml/prj/2013/1/4/04000171/img_002.jpg)
Fig. 2. 10-mm-thick MgO:PPLN with a poling period of 32.2 μm. Selected from Ref. [43].
Fig. 3. (a) Scanning electron microscopy micrograph of etched domain-inverted patterns on the +C surface. (b) Cross-section view of Y face of a PPSLT sample. Selected from Ref. [56].
Fig. 4. Output red beam with a Gaussian profile selected from Ref. [56].
Fig. 5. High-power 660 nm red laser model machine with PPSLT.
Fig. 6. Schematic experimental setup for the multicrystal CW single-pass SHG. Selected from Ref. [70].
Fig. 7. Schematic of an intracavity frequency-doubled MgO:PPSLT CW SRO for blue generation. Selected from Ref. [77].
Fig. 8. Schematic setup for 589 nm yellow generation by frequency mixing a dual-wavelength IR laser. Selected from Ref. [84].
Fig. 9. Power dependence of the output yellow light on the total pumping power in [84]. The inset on the top left is a picture of the output yellow beam, and the insert on the bottom right is the spectrum of 589 nm yellow light.
Fig. 10. Spectrum of the 589 nm yellow light by frequency doubling a high-power Raman fiber amplifier. Selected from Ref. [88].
Fig. 11. Temperature tuning curves of the red, green, and blue colors in Ref. [120].
Fig. 12. Photo of the RGB beams separated by a prism from the setup. Selected from Ref. [120].
Fig. 13. Temperature tuning curves of the RGB three colors selected from [124].
Fig. 14. Generated white light disperses into RGB three colors through a prism. Selected from Ref. [124].
Fig. 15. Elliptical spot at the focus plane of the pump. Selected from Ref. [125].
Fig. 16. (a) Micrograph of the HexPLT sample, (b) reciprocal space of the sample, and (c) photograph of the noncollinear RGB colors from the HexPLT. Selected from Ref. [128].
Fig. 17. Schematic experimental setup of passively mode-locking lasers with optical superlattice.
Fig. 18. Typical autocorrelation trace of passively mode-locked pulses with optical superlattice. Selected from Ref. [153].

Set citation alerts for the article
Please enter your email address
© Copyright 2018-2021 | Chinese Laser Press. All Rights Reserved 沪ICP备15018463号-20