• Laser & Optoelectronics Progress
  • Vol. 56, Issue 23, 233002 (2019)
Jun Hu, Yande Liu*, Aiguo Ouyang, and Hongliang Liu
Author Affiliations
  • School of Mechatronics and Vehicle Engineering, East China Jiaotong University, Nanchang, Jiangxi 330013, China
  • show less
    DOI: 10.3788/LOP56.233002 Cite this Article Set citation alerts
    Jun Hu, Yande Liu, Aiguo Ouyang, Hongliang Liu. Mid-Infrared Spectroscopy Detection of Methanol Content in Methanol Gasoline Based on CARS Band Screening[J]. Laser & Optoelectronics Progress, 2019, 56(23): 233002 Copy Citation Text show less
    Flow chart of mid-infrared detection model for determining methanol content of methanol gasoline
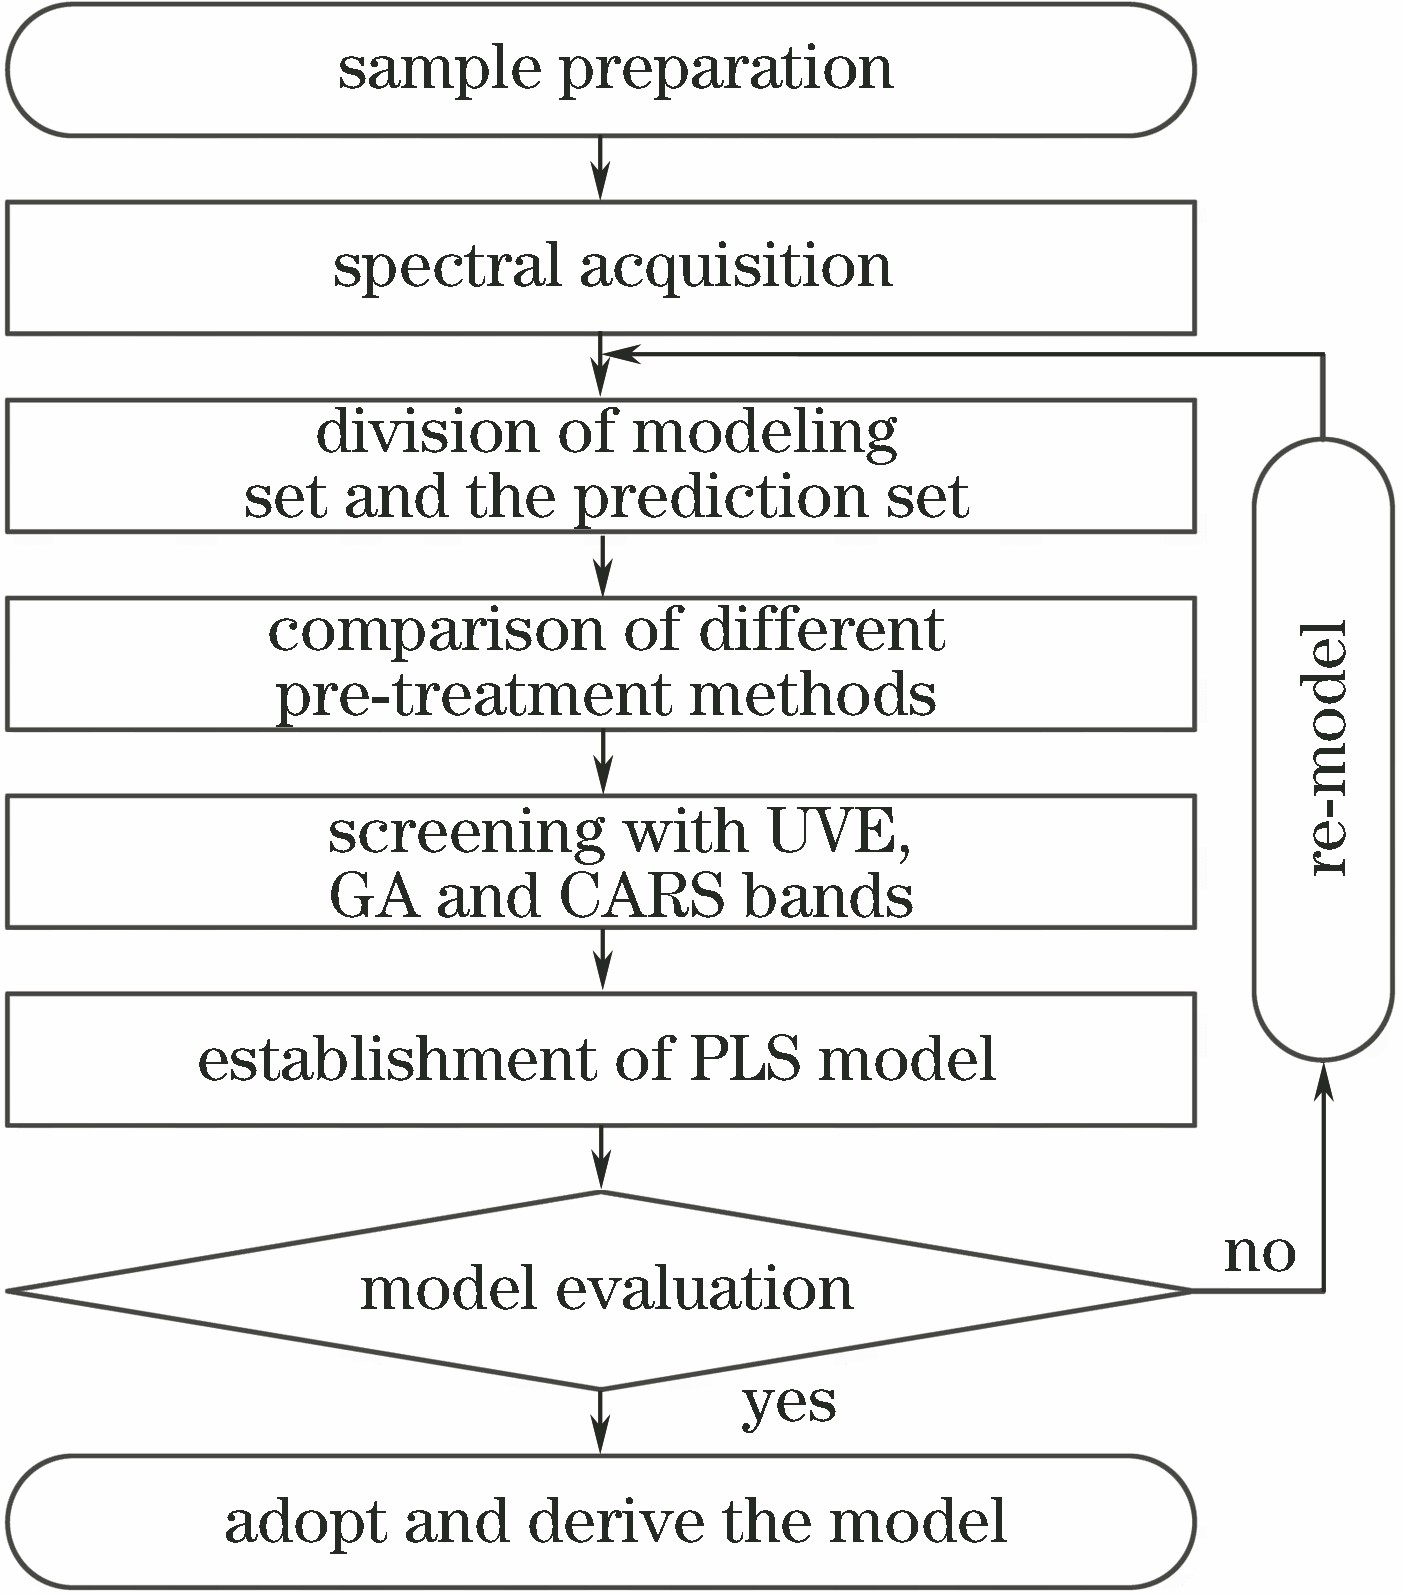
    Fig. 1. Flow chart of mid-infrared detection model for determining methanol content of methanol gasoline
    Original mid-infrared spectra of gasoline and absolute methanol. (a) Mid-infrared spectrum of gasoline; (b) mid-infrared spectrum of absolute methanol
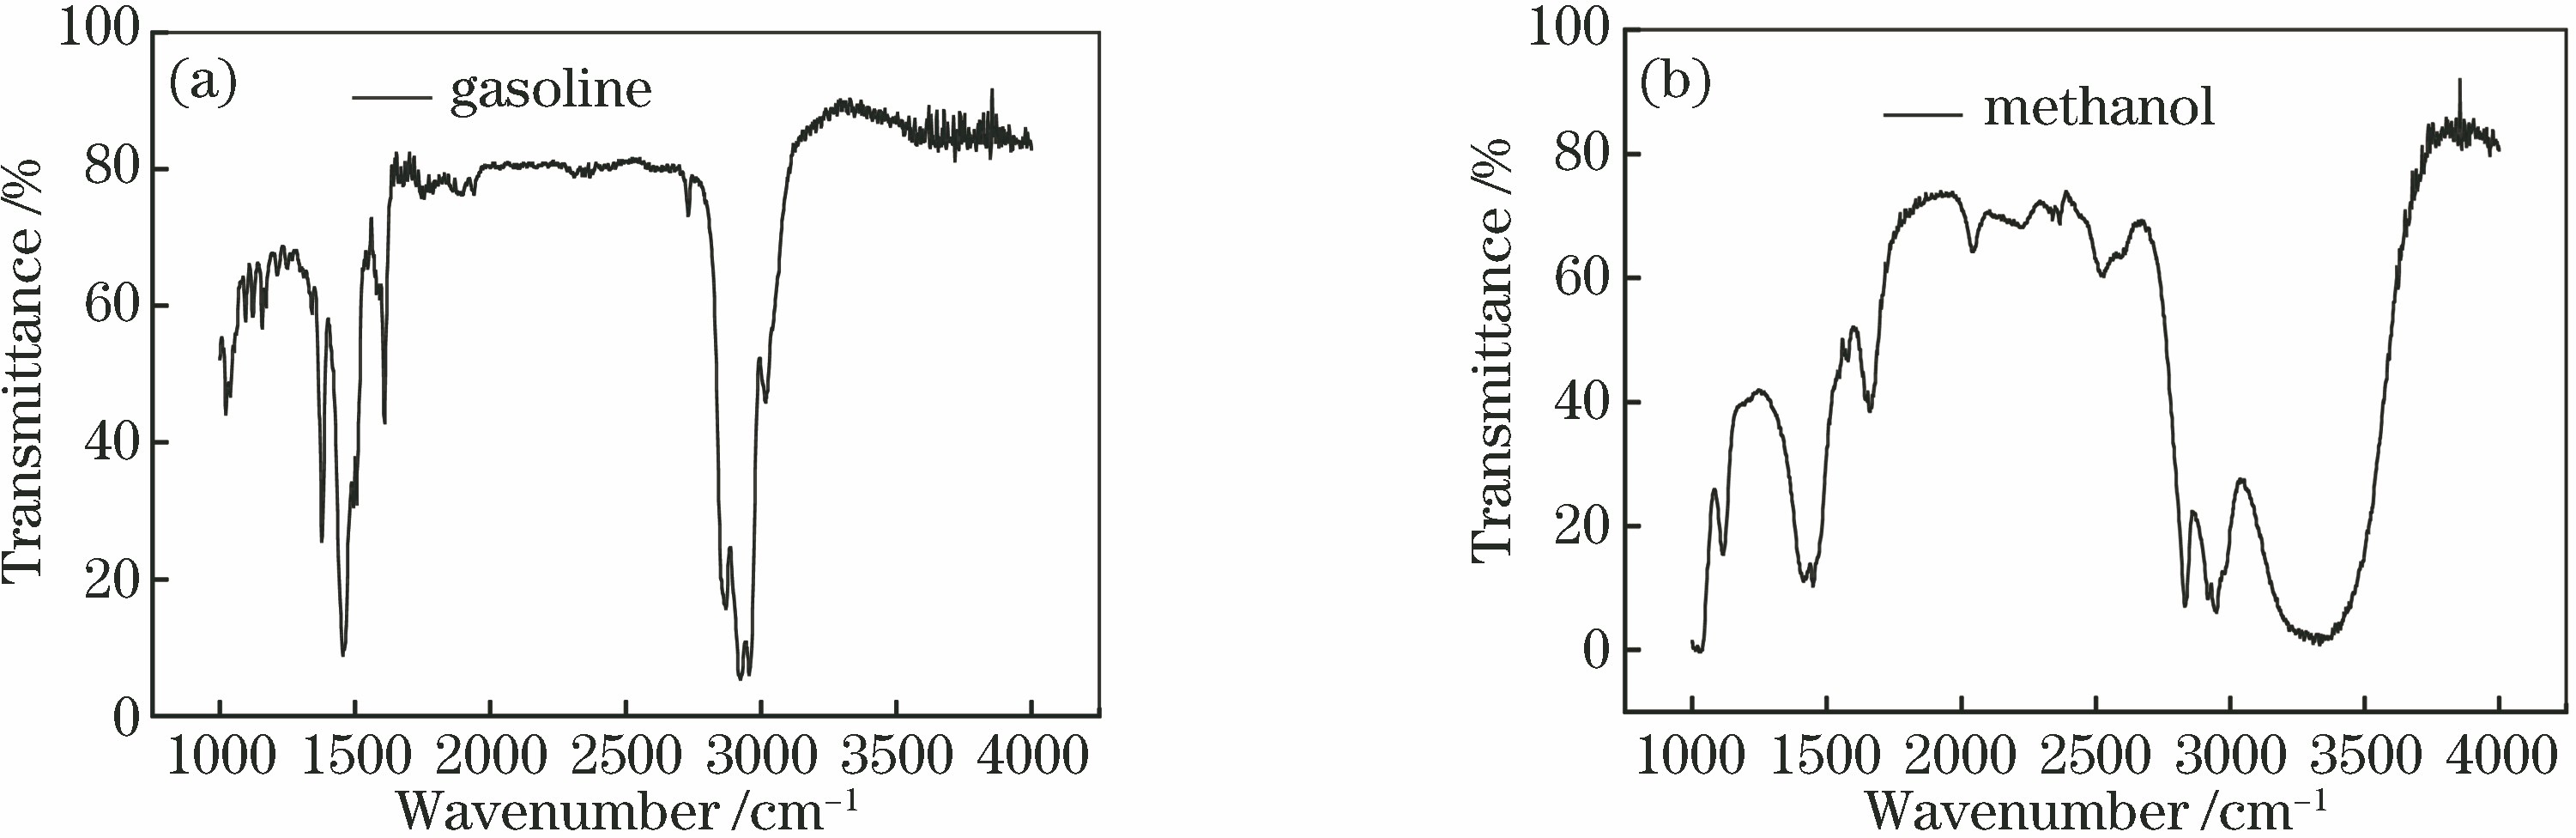
    Fig. 2. Original mid-infrared spectra of gasoline and absolute methanol. (a) Mid-infrared spectrum of gasoline; (b) mid-infrared spectrum of absolute methanol
    Original mid-infrared spectra of methanol gasoline with different methanol volume fractions
    Fig. 3. Original mid-infrared spectra of methanol gasoline with different methanol volume fractions
    Band selected by UVE method. (a) Band selection in full spectrum; (b) band points selected in full spectrum
    Fig. 4. Band selected by UVE method. (a) Band selection in full spectrum; (b) band points selected in full spectrum
    Wavelength variable screening based on CARS algorithm. (a) Number of variables versus sampling times; (b) RMSECV value versus sampling times; (c) regression coefficient versus sampling times
    Fig. 5. Wavelength variable screening based on CARS algorithm. (a) Number of variables versus sampling times; (b) RMSECV value versus sampling times; (c) regression coefficient versus sampling times
    Band points selected by CARS method within full spectrum
    Fig. 6. Band points selected by CARS method within full spectrum
    Frequency of each wavelength being selected
    Fig. 7. Frequency of each wavelength being selected
    RMSECV varying with number of variables
    Fig. 8. RMSECV varying with number of variables
    Scatter plots of methanol content in methanol gasoline predicted by CARS-PLS model. (a) Calibration set; (b) prediction set
    Fig. 9. Scatter plots of methanol content in methanol gasoline predicted by CARS-PLS model. (a) Calibration set; (b) prediction set
    Data setNMinimum /%Maximum /%Mean /%RSD /%
    Total1200.6018.609.415.37
    Calibration900.6018.609.435.25
    Prediction300.6018.609.335.45
    Table 1. Methanol volume fractions of samples in calibration and prediction sets
    PretreatmentmethodPCRcRMSECRpRMSEP
    Original90.9811.0290.9331.925
    S-G130.9970.3750.9441.772
    MSC100.9960.4500.9401.843
    SNV30.9621.4400.8732.871
    Table 2. Calibration effect of PLS corrected by middle infrared spectra of methanol gasoline
    MethodNumber of wavelengthsPCRcRMSECRpRMSEP
    PLS1557130.9970.3750.9441.772
    UVE-PLS135100.9721.2320.9481.777
    CARS-PLS11890.9940.5630.9781.177
    GA-PLS130110.9830.9940.9561.527
    Table 3. Comparison of calibration effects of different wavelength screening methods combined with PLS method
    Jun Hu, Yande Liu, Aiguo Ouyang, Hongliang Liu. Mid-Infrared Spectroscopy Detection of Methanol Content in Methanol Gasoline Based on CARS Band Screening[J]. Laser & Optoelectronics Progress, 2019, 56(23): 233002
    Download Citation